 | Mониторинг деформаций грунта из космоса |
Diagram showing how radar interferometry detects uplift of the Earth''s surface. Both the distance between the satellite positions and the amount of uplift (red layer) are exaggerated for clarity. Modified from Zhong Lu, USGS, written commun., 2004. |
Interferogram (lower) showing modeled uplift of 10 cm; Illustration by G. Bawden |
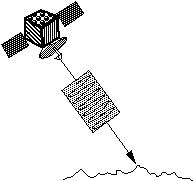
Radar Interferometry: sound send |
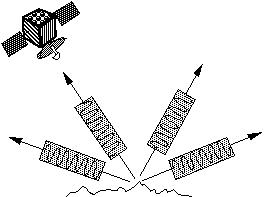
Radar Interferometry: sound returned |
Interferogram (upper image) of the Santa Clara Valley, Calif., showing patterns of subsidence (with local uplift) that occurred from January to August 1997. The shaded-relief map (lower image) translates the color-zonation pattern of the interferogram into three-dimensional topography. Vertical dimension is greatly exaggerated. From Galloway and others, 2000. |
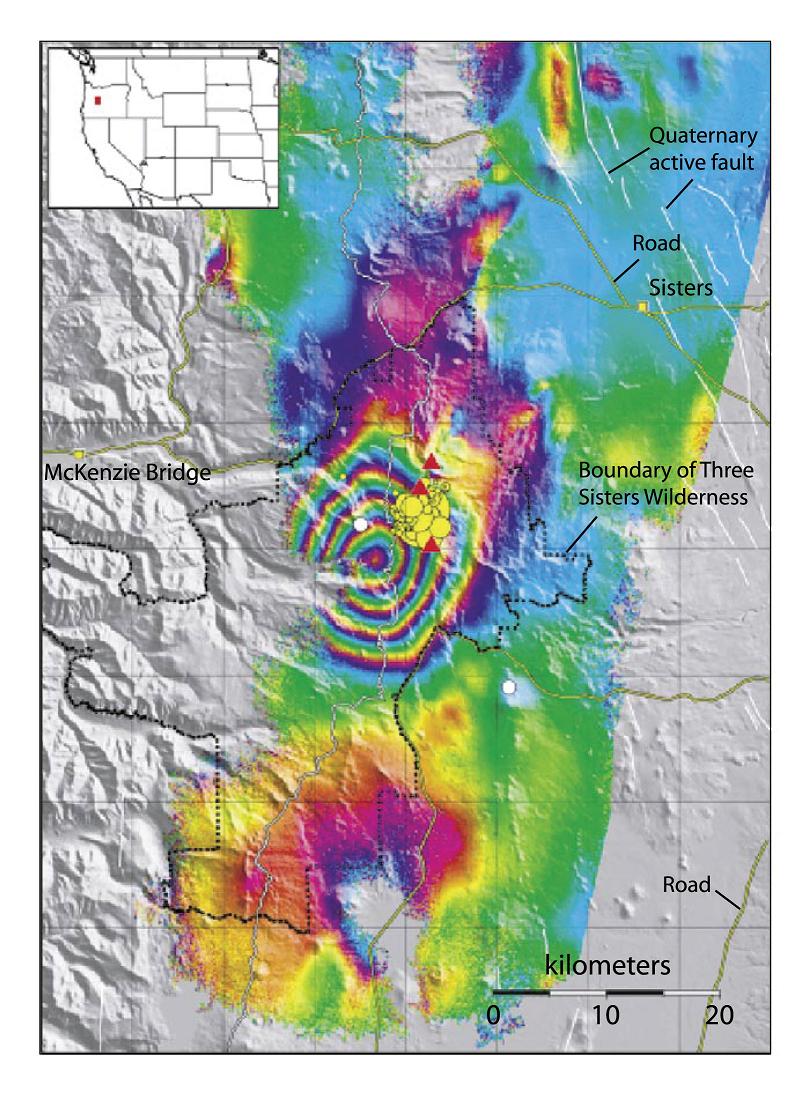
Interferogram showing the area of uplift (1997-2001) at the Three Sisters volcanoes (red triangles), in the Cascade Range in central Oregon, based on European Remote Sensing Satellite imagery. In March 2004, a swarm of more than 300 small earthquakes (yellow circles) occurred near this center of uplift. White circles, Global Positioning System stations. From Charles Wicks, USGS, written commun., 2004 |
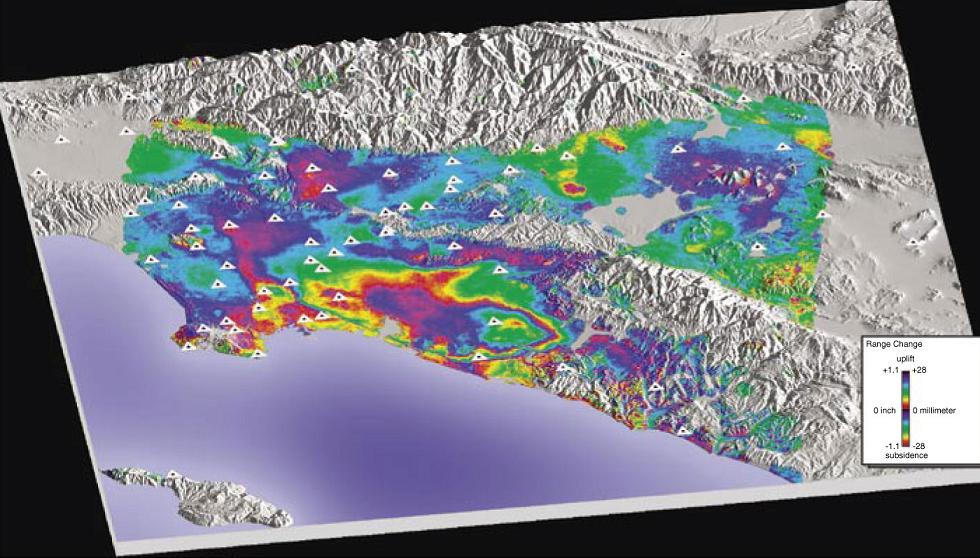
Interferogram showing deformation in the Los Angeles basin, from April 1998 to May 1999, draped over shaded-relief map. Based on European Remote Sensing Satellite imagery. Triangles, Global Positioning System stations. Modified from Bawden and others, 2001. |
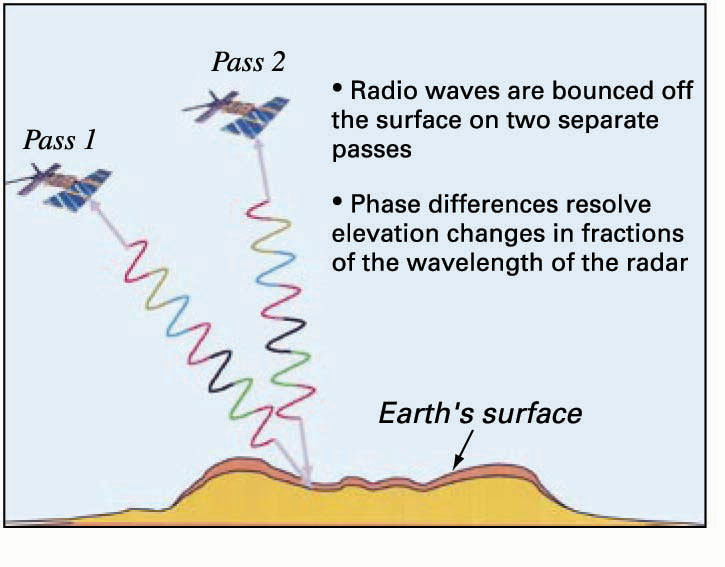
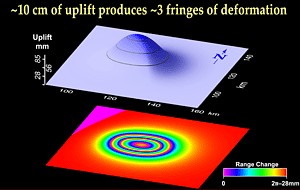

Satellite-based tetechnique captures overall deformation "picture"chnique . For years, scientists dreamed of a "geodetic camera" capable of snapping a picture that would show in exquisite detail how much the ground near a volcano was moving. The dream has become reality: images of deforming volcanoes are being produced in breathtaking color from data acquired by spacecraft! For example, when the ground is uplifted by 10 cm, satellite images of the area recorded before and after the uplift can be combined to generate a colorful pattern of fringes . Each of the three fringes (from violet to red) represents a change in the satellite-to-ground distance of about 3 cm.
Until recently, all of the techniques we used to measure volcano deformation (for example, electronic distance measurements, tiltmeters, and the Global Positioning System) were based on detecting changes at specific points on the ground surface. The amount and direction of movement of these points enabled us to piece together the overall pattern of deformation on a volcano. The situation is analogous to trying to discern the pattern of an assembled jigsaw puzzle after 99% of the pieces have been removed.
By choosing the locations of benchmarks, tiltmeters, and GPS stations carefully, we can usually track recurring patterns of deformation reasonably well, especially over short periods of time (minutes to days). But we can never be sure that we are seeing the whole picture, or that we aren''t missing small-scale deformation that slipped through the cracks, so to speak, of our monitoring networks. Under favorable conditions, satellite radar interferometry promises to show us the whole deformation picture.
Using a series of radar images acquired by the European Space Agency''s ERS satellites, Didier Massonnet and others (1993) produced a striking image of ground displacements caused by the magnitude 7.3 Landers earthquake, which struck about 150 km east of Los Angeles on 28 June 1992.
Geodesists around the world were struck by the remarkable detail visible in the image, which resembled the displacement pattern predicted by theoretical models of such an earthquake. The pattern had never before been fully observed in the field, because conventional ways of measuring ground deformation were capable of filling in only a few pieces of the puzzle. Suddenly, all of the pieces fell into place and the race was on to apply the amazing new technique, called satellite radar interferometry, to other sources of ground deformation, including volcanoes.
One important advantage of using radar rather than visible or infrared light to image the Earth''s surface: radar waves penetrate most weather clouds and are equally effective in darkness. So our amazing geodetic camera can "see" through clouds and at night!
How satellite radar interferometry works
Return signal from satellite holds the key
The technical details of how and why radar interferometry works are rooted in physics and radar engineering, but for our purposes a much simpler explanation will suffice. A pulse of radar energy is successively emitted from a satellite (left), scattered by the Earth''s surface, and recorded back at the satellite. The radar energy received by the satellite contains two important types of information.
The first type information is encoded in the strength or amplitude of the return signal, which is influenced by various physical properties of the surface including ground slope, particle size (i.e., sand versus boulders), and soil moisture. The ERS satellites record return signal strength from a continuous swath of the Earth''s surface about 100 km wide (60 mi) wide, and scientists on the ground assemble this information in the form of a radar image. The image is a portrayal of the surface that resembles a conventional photograph in some ways, but not entirely. Think of the difference between a conventional photo and an infrared image, which shows warm areas as bright irrespective of their brightness in visible light. Radar images differ from conventional photos in a similar way.
The second type of information contained in the return radar signal has to do with the round trip distance from the satellite to the ground and back again. We can think of a radar pulse as an invisible tape measure calibrated in units of the radar wavelength. We call the fractional part of the round trip distance the phase of the return signal. For the ERS satellites, the radar wavelength is 5.66 cm (2.2 inches).
If we were able to acquire two radar images at different times from exactly the same vantage point in space and compare them, any movement of the ground surface toward or away from the satellite would show up as a phase difference between the images. For example, if a point on the ground moved toward the satellite (mostly upward) by one-half wavelength, the phase of the return signal from that point would increase by one full wavelength relative to the first image. It isn''t possible to steer a satellite accurately enough to return it to exactly the same point in space on different orbits, but it''s relatively easy to get within a few hundred feet and then do the necessary geometric corrections.
Combining or "interfering" images from different satellite passes
It turns out that the most accurate way to measure small phase changes is to combine two images together after all of the necessary corrections have been made. This process is sometimes called "interfering" the images, because combining two waves causes them to either reinforce or cancel one another, depending on the relative phases. For example, you may have observed interference between two sources of water waves on a pond. Now imagine that we can keep track of all the places where two radar images reinforce one another, and all the places they cancel one another. We''ll represent the first case as a red pixel in a new image that we''ll create, and the second case as a blue pixel. Intermediate cases will be represented as intermediate colors of the spectrum from red to blue. The resulting image is called an interferogram.
The properties of waves are such that we can''t tell the difference between waves that reinforce one another because they are exactly in phase with one another, or out of phase by any number of whole wavelengths (1, 2, 3...). As a result, an interferogram for an area that domed upward during the time interval between two radar images would show a concentric pattern of color bands, called fringes, not unlike the contours on a topographic map (left). In this case, though, each fringe would represent just one-half wavelength of surface movement toward the satellite--nearly 3 cm for ERS (just over an inch). To determine the total amount of movement, we only have to count the number of fringes. Our geodetic camera is ready to track volcano deformation from space!
see more http://volcanoes.usgs.gov/activity/methods/insar/more_insar.html
NEW RESEARCH, RESULTS, and/or PROJECTS
Radar Interferometry
Monitoring Ground Deformation from Space