 | California, Crust |
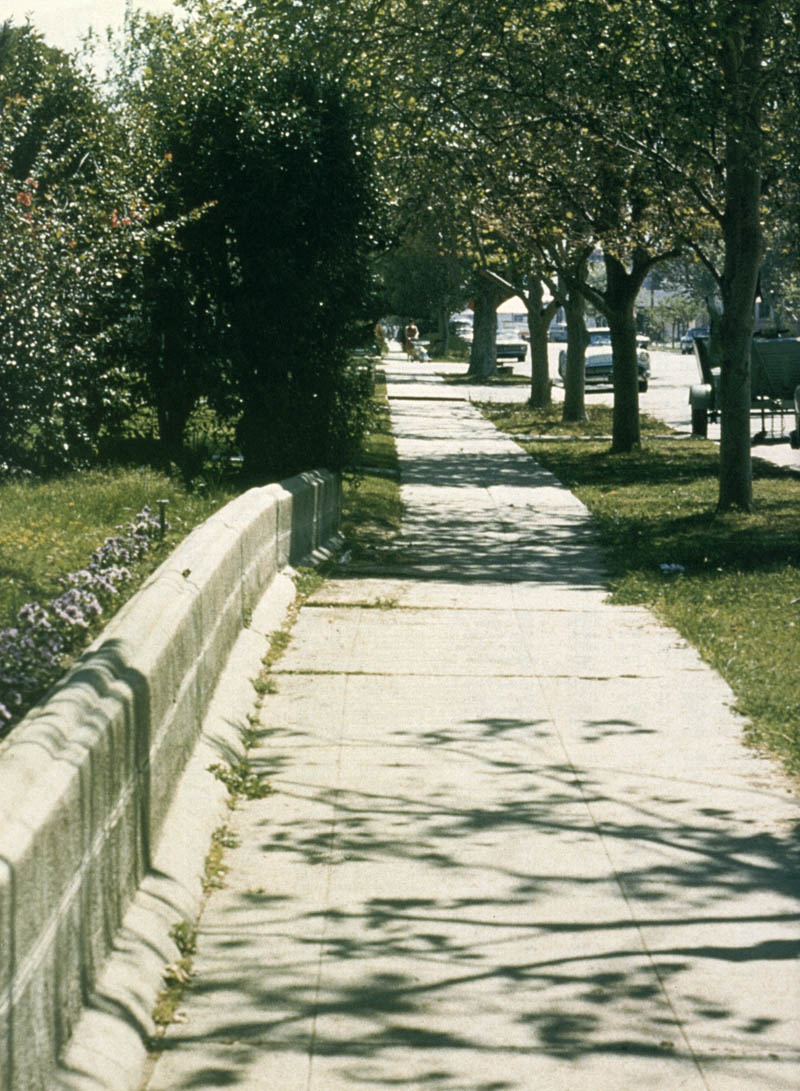
A wall and sidewalk in Hollister, Calif., are bent and offset by creep on the Calaveras fault. A slip rate of 5 to 6 mm/yr characterizes much of the Calaveras fault. View eastward along north side of Sixth Street. Photograph by R.E. Wallace, U.S. Geological Survey |
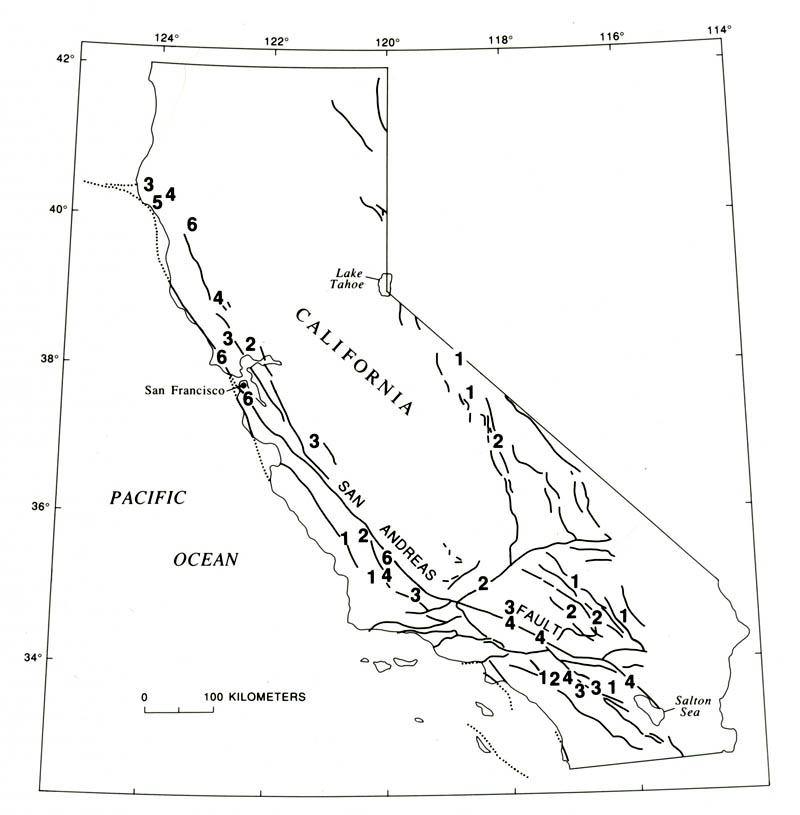
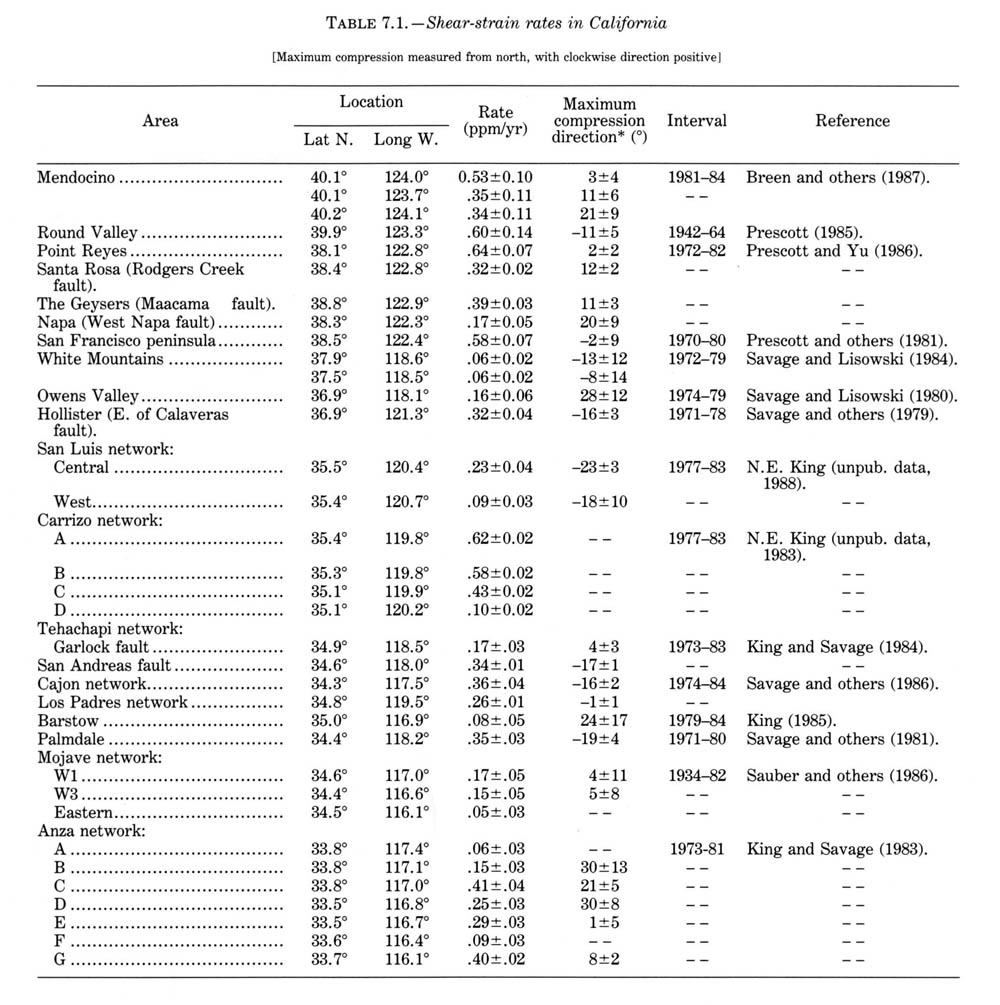
Shear-strain rates (in 10step(-7) rad/yr) and major active Quaternary faults of California; faults dotted where concealed. |
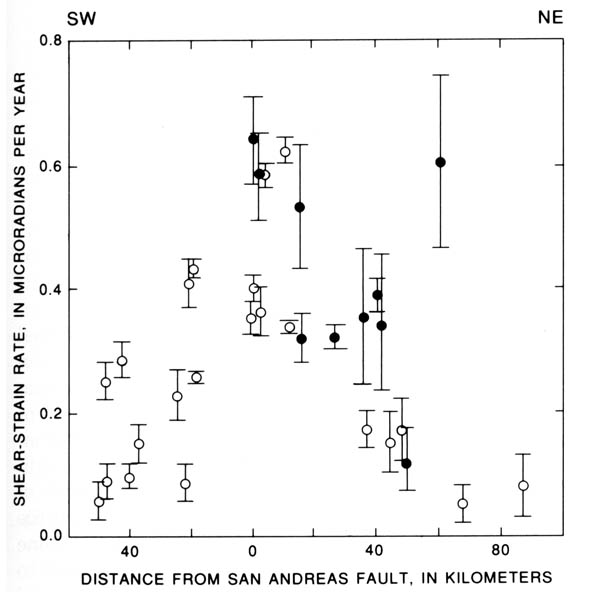
Shear-strain rate versus perpendicular distance from the San Andreas fault. Dot, determination from northern California; circle, determination from southern California. |
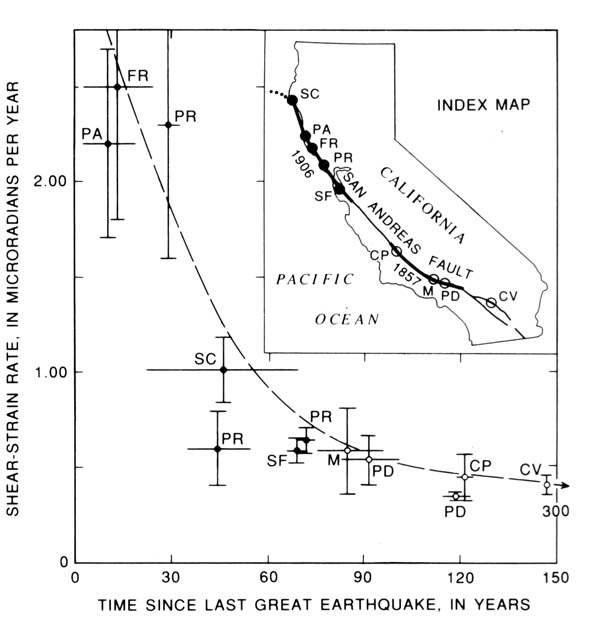
Shear-strain rate versus time since last great earthquake (years 1906 and 1857 in inset; heavy line indicates extent of fault rupture) on the San Andreas fault. CP, Carrizo Plain; CV, Coachella Valley; FR, Fort Ross; M, Mojave; PA, Point Arena; PD, Palmdale; PR, Point Reyes; SC, Shelter Cove; SF, San Francisco. Locations of data points are keyed to index map. For each data point, vertical bar is 1 у, and horizontal line indicates time interval between surveys. Data points are plotted at middle of intervals. Dots, determinations from northern California; circles, determinations from southern California; dashed curve, approximate fit to data (Thatcher, 1983). |
Shear-strain rates in California |
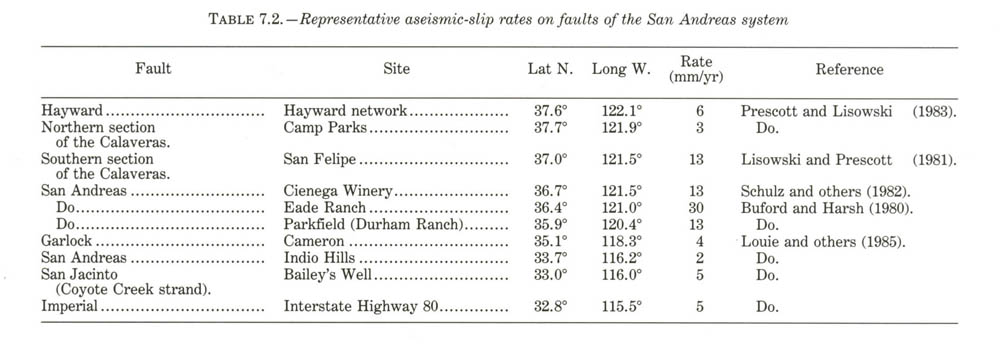
Representative aseismic-slip rates on faults of the San Andreas system |
Sketch map of California, showing rates (red numbers) of aseismic slip (fault creep) and relative right-lateral-displacement rates (blue numbers) near arrows, which indicate direction of relative movement along major active strands of the San Andreas fault system. Values in millimeters per year. Locked (no surface slip) segment of major fault, red line; other Quaternary fault, black line; faults dotted where concealed. |
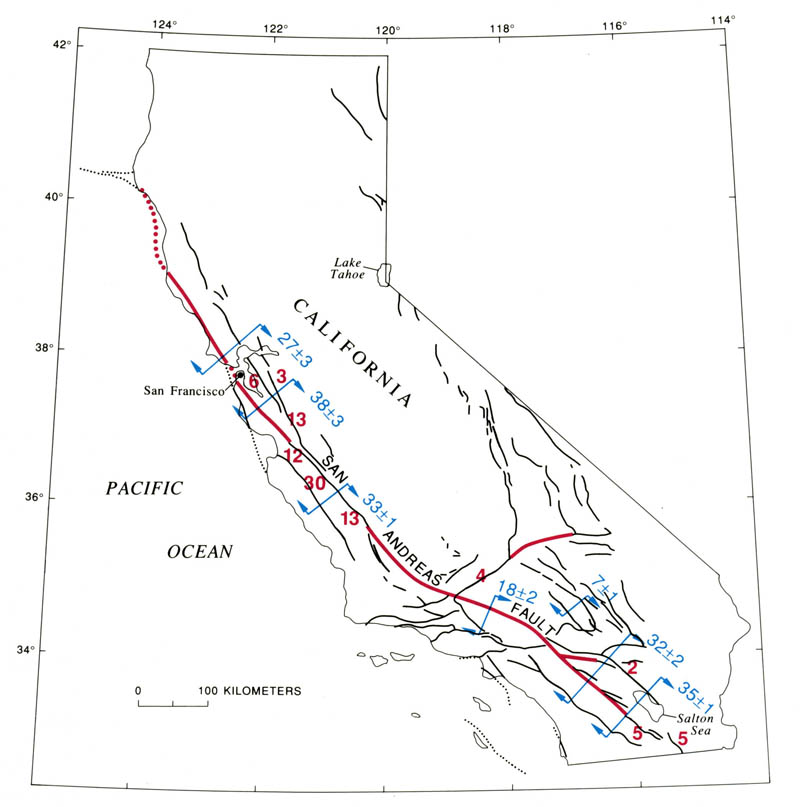
Displacement rates across the San Francisco Bay region. A, Relative right-lateral displacement rates determined from repeated geodetic surveys made during 1971-87. Error ellipses show 95-percent-confidence limits for each determination (Prescott and others, 1987). B, Relative station velocities parallel to approximate trend of the San Andreas fault (N. 33░ W.) plotted against distance perpendicular to this trend for north bay. 1-у bars are indicated. Perpendicular velocity component is negligible and omitted here. |
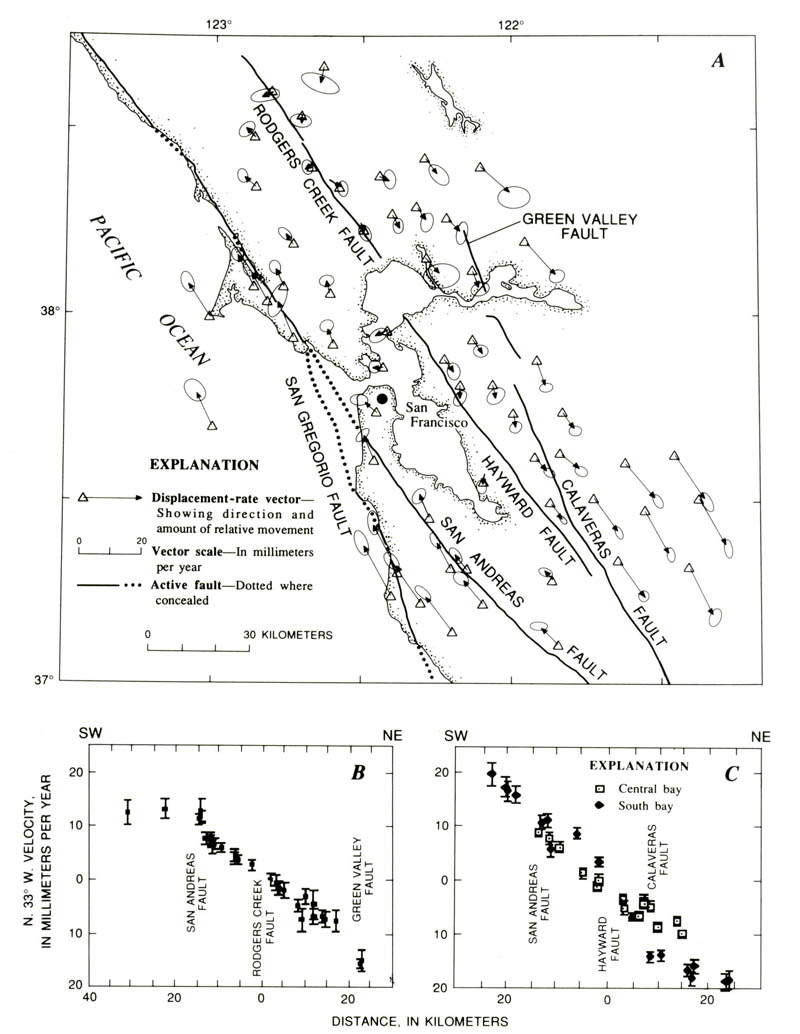
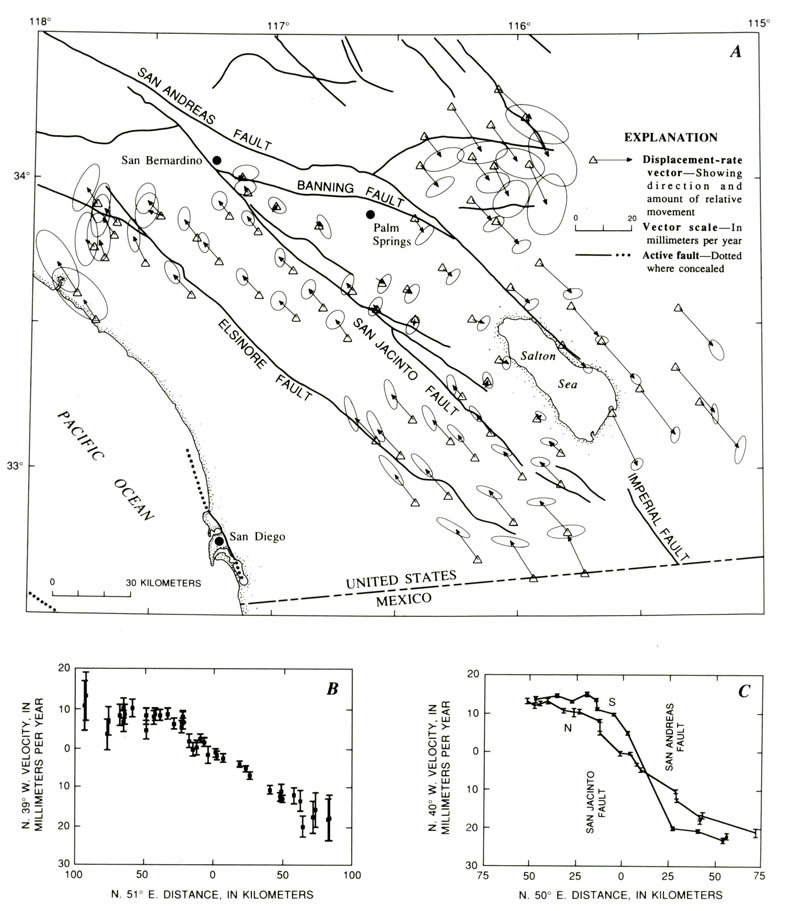
Displacement rates in southern California. A, Relative right-lateral displacement rates determined from repeated geodetic-survey measurements during 1973-87. Error ellipses show 95-percent-confidence limits for each determination (Prescott and others, 1987). B, Relative station velocities parallel to approximate trend of the San Andreas fault (N. 39░ W.) plotted against distance perpendicular to this trend, for stations in northern part of map in figure 7.7A. 1-¾ error bars are indicated. Perpendicular velocity component is negligible and is not plotted here. C, Same as figure 7.7B for stations largely to north (N) and south (S) of the Salton Sea |
C http://geologycafe.com/california/pp1515/chapter7.html by Wayne Thatcher, U.S. GEOLOGICAL SURVEY
PROFESSIONAL PAPER 1515
Contemporary crustal movements in California are concentrated within a plate-boundary deformation zone that is typically 50 to 200 km wide, centered approximately on the San Andreas fault. Observations of coseismic, postseismic, and interseismic movements define the earthquake deformation cycle and constrain models of strain accumulation and release for strike-slip plate boundaries.
Crustal movements measured in California today sample deformation processes that have continued through at least the past 5 Ma of Pliocene, Pleistocene, and Holocene time. During this interval, several hundred kilometers of right-lateral offset has accumulated across the San Andreas fault system, and many thousands of great earthquakes similar to the historical events of 1857 and 1906 have undoubtedly occurred. The observed deformation results from relative right-lateral translation of the Pacific and North American plates far from the main plate-boundary faults, which are either freely slipping and without major seismic activity, or are in locked frictional contact and slip episodically in repeated great earthquakes. Aseismic fault slip (creep), as occurs across the San Andreas fault in central California causes no crustal deformation beyond a growing offset across the fault, although this offset may be distributed across a zone as broad as a few tens or hundreds of meters. Where the plate-boundary fault is alternately locked aseismically in its upper 10 km or so and abruptly slipping in great earthquakes, deformation extends several tens of kilometers into the plate interiors. Between large events, elastic strains build up in this zone and are episodically released every few hundred years. Subsequent postearthquake recovery processes redistribute the strains aseismically for years to decades after a major shock, and this deformation gradually merges into the steady accumulation of elastic-strain energy that persists until the frictional strength of the fault is again exceeded. This sequence of interearthquake strain accumulation, coseismic strain release, and postseismic readjustment is thus a recurring process, here referred to inclusively as the earthquake deformation cycle.
Several fault-zone features result in measurable deformation spread over an extremely broad plate-boundary zone. This deformation occurs where the San Andreas fault system comprises several subparallel splays, as in both the San Francisco Bay region and southern California. There, both aseismic slip and major strike-slip earthquakes have been documented, some on the same fault strand, and the entire zone of plate-boundary deformation is exceptionally broad. Major changes in fault strike also play a role in redistributing plate-boundary deformation and diffusing it over a wider zone. Compressional bends introduce uplift, crustal thickening, and subsidiary reverse faulting, such as in the Transverse Ranges of southern California. Extensional bends are characterized by subsidence, basin filling, and, possibly, volcanism, as occurs in the Imperial Valley. Extensional and compressional features are more localized at the smaller-scale discontinuities and changes in fault strike that occur throughout the San Andreas system.
Crustal movements observed at the surface reflect deformation processes occurring at depth in the lithosphere. Both laboratory rock-mechanics experiments and studies of exhumed fault zones define the nature of these processes, which, in turn, constrain the classes of large- scale faulting models consistent with surface measurements. In the cool and brittle seismically active parts of the crust, elastic processes are dominant, the frictional strength of active faults increases linearly with depth, and faulting is controlled by Coulomb failure. The transition from brittle seismic behavior to ductile aseismic deformation occurs in the midcrust. Although it is generally agreed that this transition occurs as a result of increasing temperature, its precise mechanism is uncertain. If deformation in the midcrust is concentrated within a narrow vertical shear zone lying beneath the seismically active fault plane, then the brittle/ductile transition may reflect either the increasing importance of ductile or cataclastic flow at depth (Sibson, 1982) or a thermally controlled transition from unstable to stable frictional sliding (Brace and Byerlee, 1966; Tse and Rice, 1986). However, if ductile deformation is broadly distributed in the midcrust, then the cyclic buildup and relief of stresses in the brittle seismogenic crust is controlled by the stress transfer between the elastic lithosphere and ductile "asthenosphere" and the flow properties of the latter.
Both the steady, aseismic movements within the San Andreas plate-boundary zone and the coseismic strain release in large earthquakes are well within the range of detectability of repeated geodetic-survey measurements. The purpose of this chapter is to summarize the salient features of these observations, demonstrating the constraints they place on the amount of present-day plate motion occurring across the San Andreas plate-boundary zone and showing how measurements shed light on the mechanics of the cycle of strain accumulation and release. The emphasis is necessarily on movements close to the main strands of the San Andreas fault system, where observations are most numerous, although some networks extend as far as 100 km from the major faults. The measurements include triangulation, repeated observations of the angular separation of permanent survey markers, for which useful data date back to about 1850, when gold was first discovered in California; trilateration, repeated line-length measurements made by laser ranging since about 1970; and local measurements of aseismic fault slip made periodically or recorded continuously over apertures of about 10 to 100 m since about 1960.
OBSERVATIONS OF CRUSTAL DEFORMATION
The focus here is on the spatial and temporal patterns of interearthquake horizontal crustal movements in California that owe their origins to relative motion between the Pacific and North American plates, movements that supply the strain energy which is stored in crustal rocks and ultimately released in large shallow-focus earthquakes. Observations of purely coseismic crustal deformation are not explicitly considered in this chapter; such movements are now well-understood consequences of slip on approximately the upper 10 to 15 km of vertical strike-slip faults. These models and their predicted deformation patterns are discussed within the context of the entire earthquake deformation cycle in the next section. Readers interested in the coseismic movements observed for specific San Andreas earthquakes are referred to the reports by Lawson (1908) and Thatcher (1975) (1906 San Francisco earthquake), Zhang and others (1988) (1940 El Centro earthquake), and Segall and Harris (1987) (1966 Parkfield earthquake).
Vertical crustal movements can locally be substantial, at least when averaged over recent geologic time (see Yeats, 1977; Lajoie, 1986). Deformation from reverse-faulting earthquakes has also been well documented in several events (for example, 1952 Kern County earthquake by Stein and Thatcher, 1981; 1971 San Fernando earthquake by Castle and others, 1975; 1983 Coalinga earthquake by Stein, 1983). Nonetheless, vertical movements are second-order features along most of the San Andreas fault system, and so they are not considered further in this chapter.
Furthermore, in this chapter there is no review of measurement techniques, methods of analyzing and reducing data, or the mathematical and computational tools used in modeling deformation processes. Interested readers are referred to the reports by Bomford (1980) and Savage and Prescott (1973) for descriptions of horizontal-deformation-surveying methods and their precision, to those by Prescott (1976, 1981), Thatcher (1979), and Segall and Harris (1987) for discussions of data-analysis methods, and to the references cited below in the section entitled "Mechanics of Deformation" for details of the mathematical techniques used in model formulation.
Horizontal interearthquake deformation is summarized below in rates of both displacement and shear strain. For both of these parameters, the components parallel to major active faults are the most significant and best illustrate the dominant pattern of present-day tectonic movements, and so in this chapter these components are commonly shown exclusively. For example, although three independent tensor components are needed to completely characterize the horizontal-deformation field, in California the only significantly nonzero strain-rate component is commonly the shear strain parallel to the local trend of faults in the San Andreas system. Here, I consider only the component of maximum horizontal shear-strain rate, which, within observational uncertainty, almost invariably parallels the San Andreas fault or one of its major strands.
SHEAR STRAIN ON THE SAN ANDREAS FAULT SYSTEM
Rates of contemporary shear strain are displayed in several complementary ways in figures 7.2 through 7.4,for each of the strain rates shown in figures 7.2 through 7.4, aseismic fault slip contributes only negligibly, if at all, to the measured deformation.
Shear-strain rates peak at 0.4 to 0.6 mrad/yr across the currently locked northern and southern sections of the San Andreas fault. Significant but slightly lower strain rates of 0.3 to 0.4 мrad/yr are observed across right-lateral strike-slip faults in the northern California Coast Ranges (north of lat 38░ N.) east of the San Andreas fault, as well as across the San Jacinto fault in southern California. Shear-strain rates resolvably greater than zero are observed as far as about 80 km from the San Andreas fault itself.
In addition, significant deformation is occurring across active faults in east-central California. In the White Mountains, along the southern California-Nevada State line, small but resolvable strain rates (0.06▒0.02 mrad/yr) have been measured, and the orientation of the strain field indicates crustal extension perpendicular to north-south-striking normal faults in the area. Somewhat higher deformation rates are observed farther south, where right-lateral strain is occurring parallel to the Owens Valley fault, site of the M8 earthquake of 1872.
Shear-strain rate is plotted as a function of perpendicular distance from the San Andreas fault in figure 7.3. Deformation rates peak at the fault and decrease to half their maximums at a distance of about 30 km from the fault. Most of the deformation is encompassed within a zone about 100 km wide centered on the fault ("San Andreas boundary deformation zone"), as discussed below. However, the reader may confirm that this total lies in the range of about 30-40 mm/yr by drawing a smooth curve through the data plotted in figure 7.3 and integrating this curve (that is, measuring and summing the total area underneath the curve) from -60 to +60 km.
Maximum shear-strain rates at the San Andreas fault tend to be higher across the 1906 earthquake rupture in northern California (approx 0.6 мrad/yr) than in southern California (0.4 мrad/yr), although the Carrizo Plain data violate this generalization. Rather high deformation rates are also observed 20 to 60 km east of the San Andreas fault in the northern California Coast Ranges.
Shear-strain rates at various locations on the two currently locked sections of the San Andreas fault are plotted versus time since the most recent great earthquake at each locality in figure 7.4. Most of these data are derived from triangulation measurements, many of which were first made in the late 19th or early 20th century. Thus, these determinations are much less precise than those listed in table 7.1 and plotted in figures 7.2 and 7.3, most of which are from the post-1970 period. Nonetheless, it is clear from figure 7.4 that deformation rates on the fault are much higher in the years to tens of years immediately after a great earthquake than they are later. Although it may be questionable to lump values from northern and southern California together on a single plot, the temporal decline in shear-strain rate shown in figure 7.4 depends only on about the first 70 years of data plotted, all of which come from the 1906 rupture on the northern section of the San Andreas fault
ASEISMIC SLIP, INTEGRATED DISPLACEMENT RATES, AND PACIFIC-NORTH AMERICAN PLATE MOTION
With the notable exception of the central, creeping section of the San Andreas fault, aseismic slip at the surface represents only a very small proportion of the total right-lateral displacement across the San Andreas fault system. On the 160-km-long central section of the San Andreas fault, maximum fault-creep rates average 30 mm/yr, close to the geodetically derived displacement rate of 33▒1 mm/yr obtained over a 60-km aperture that spans the fault and the California Coast Ranges to the southwest. These data are the strongest evidence that no significant strain is accumulating in the crustal blocks adjacent to the fault in this region, and so all the relative plate motion taken up by the San Andreas system is here being accommodated by rigid-block translation across the fault. Just north of this segment, on the southern section of the Calaveras fault, a significant amount of right-lateral slip at a rate of about 13 mm/yr, occurs as fault creep. Elsewhere in California, however, measured aseismic-slip rates range from 2 to 6 mm/yr, and creep commonly occurs only on restricted segments of otherwise-locked faults (for example, the Garlock and San Jacinto faults).
The integrated right-lateral displacement rates shown in figure 7.5 firmly constrain the proportion of Pacific-North American relative plate motion accommodated across the San Andreas fault system in California. In northern, central, and southern California, maximum rates range from 33 to 37 mm/yr. Global reconstructions of the motions of the major tectonic plates over the past 3 Ma, as well as analyses of magnetic-anomaly lineations at the mouth of the Gulf of California, point to a relative Pacific-North American plate-motion rate of 49▒3 mm/yr (DeMets and others, 1987). The San Andreas fault system thus accounts for 70 to 80 percent of the relative plate motion, although the San Andreas fault itself does not everywhere take up all of this motion, and deformation is typically distributed across a boundary zone about 100 km wide.
Precisely how much additional relative plate motion is accommodated across other faults in California is uncertain, although the amount is probably very little. According to