 | SEISMICITY OF COAST AND TRANSVERSE RANGES AND REGIONS |
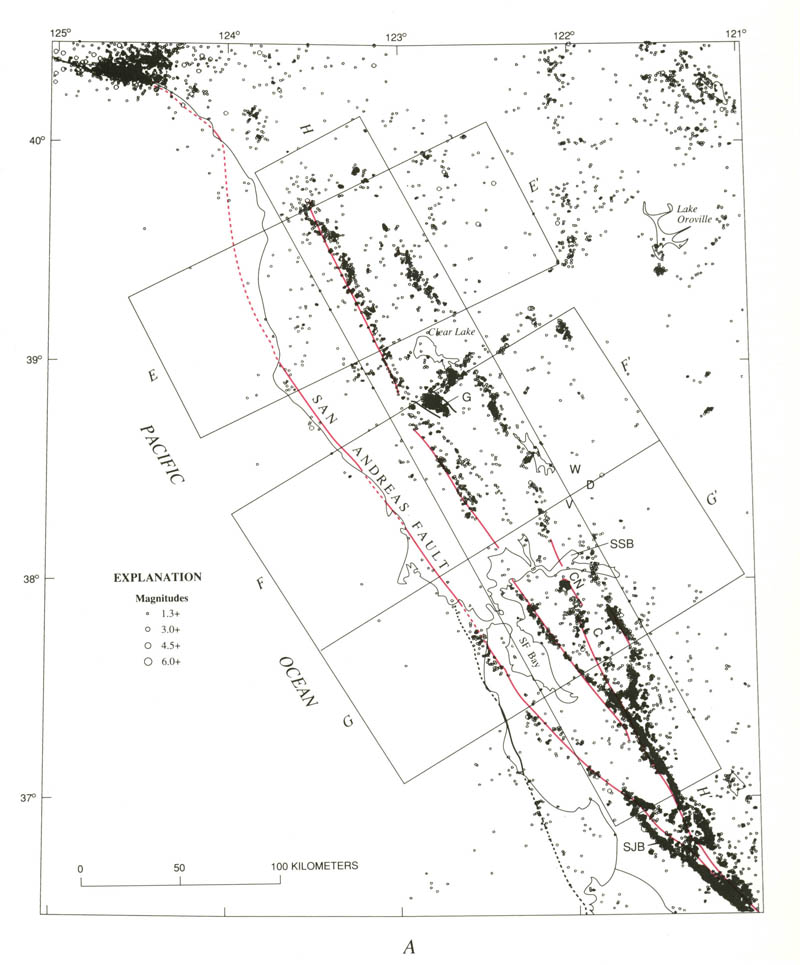
Seismicity in the northern Coast Ranges. Major branches of the San Andreas fault marked in red; faults dotted where concealed. Earthquakes within rectangles are plotted in corresponding depth sections in figures 5.7 and 5.8. C, Calaveras fault; CN, Concord fault; G, The Geysers; SF Bay, San Francisco Bay; SJB, San Juan Bautista; SSB, Suisun Bay; D, Dixon; V, Vacaville; W, Winters. |
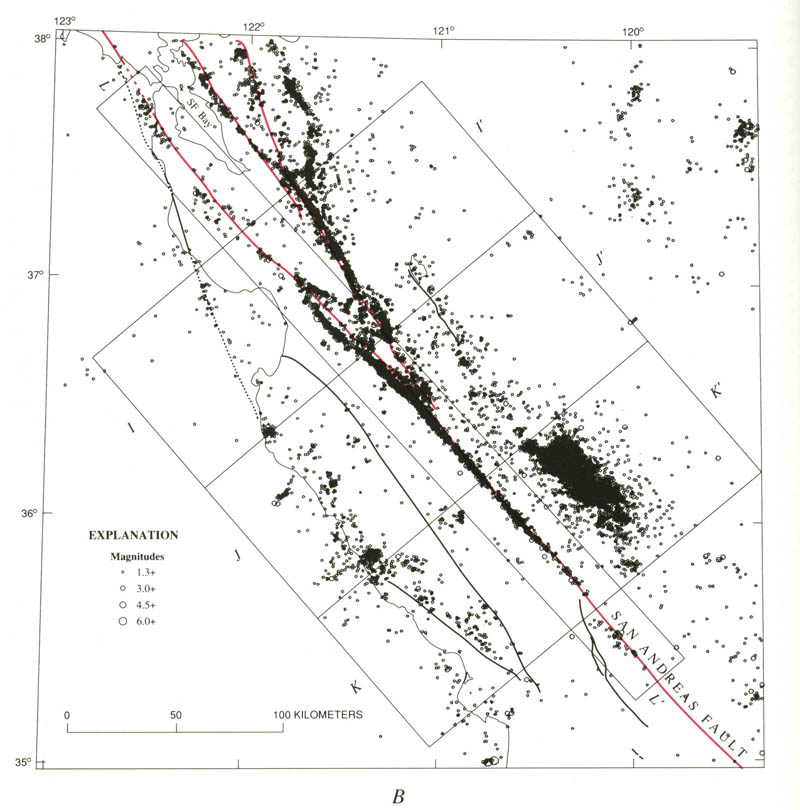
Seismicity in the central Coast Ranges. Major branches of the San Andreas fault marked in red; faults dotted where concealed. Earthquakes within rectangles are plotted in corresponding depth sections in figures 5.7 and 5.8. C, Calaveras fault; CN, Concord fault; G, The Geysers; SF Bay, San Francisco Bay; SJB, San Juan Bautista; SSB, Suisun Bay; D, Dixon; V, Vacaville; W, Winters.http://geologycafe.com/california/pp1515/chapter5.html |
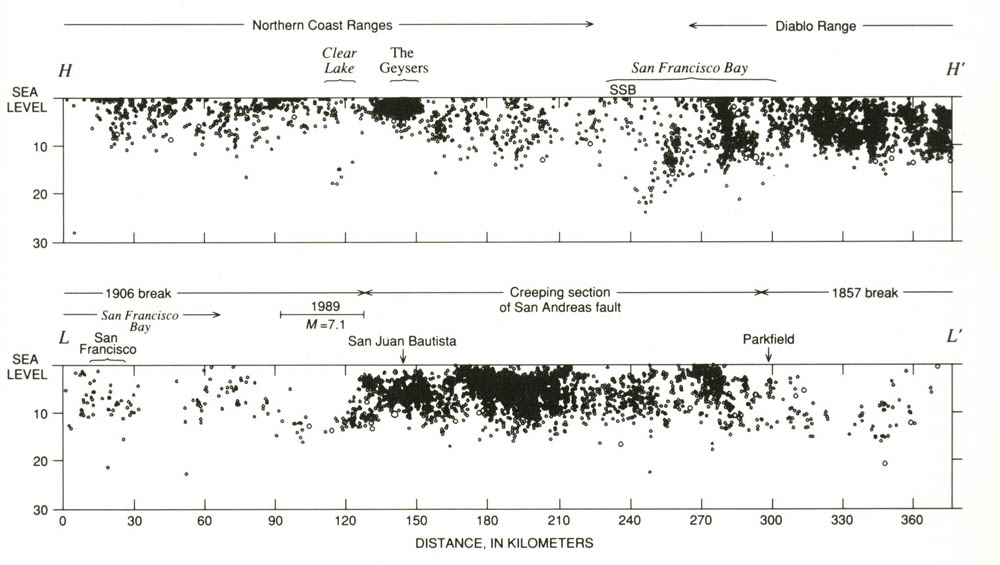
Longitudinal depth sections along the San Andreas fault system in the northern and central Coast Ranges. Bar above section L-L'' indicates rupture extent of the October 17, 1989, Lorna Prieta M=7.1 earthquake (see chap. 6). SSB, Sui sun Bay. See figure 5.6 for locations of sections and explanation of symbols, which are scaled with scale change of cross sections |
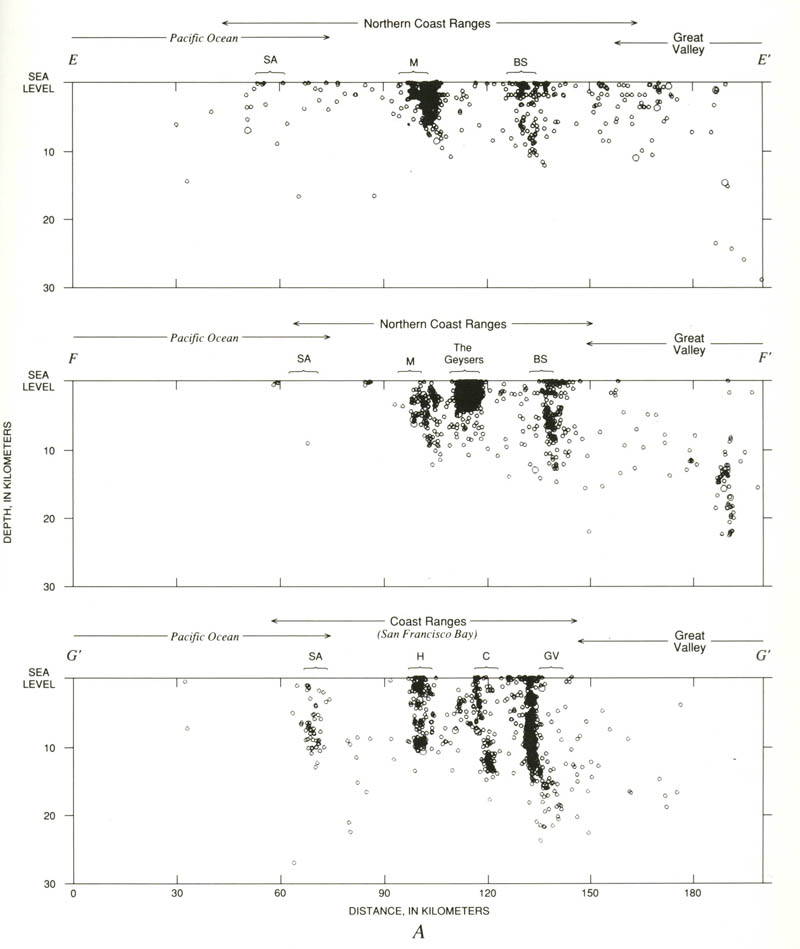
Transverse depth sections across the San Andreas fault system in the northern Coast Ranges. See figure 5.6 for locations of sections and explanation of symbols, which are scaled with enlargement of cross sections. Faults: BS, Bartlett Springs; C, Calaveras; GV, Greenville; H, Hayward; M, Maacama; R, Rinconada; SA, San Andreas; SG, San Gregorio; SNA, Sur-Nacimiento. BV, Bear Valley on cross section J-J''. FRT, Franciscan terrane |
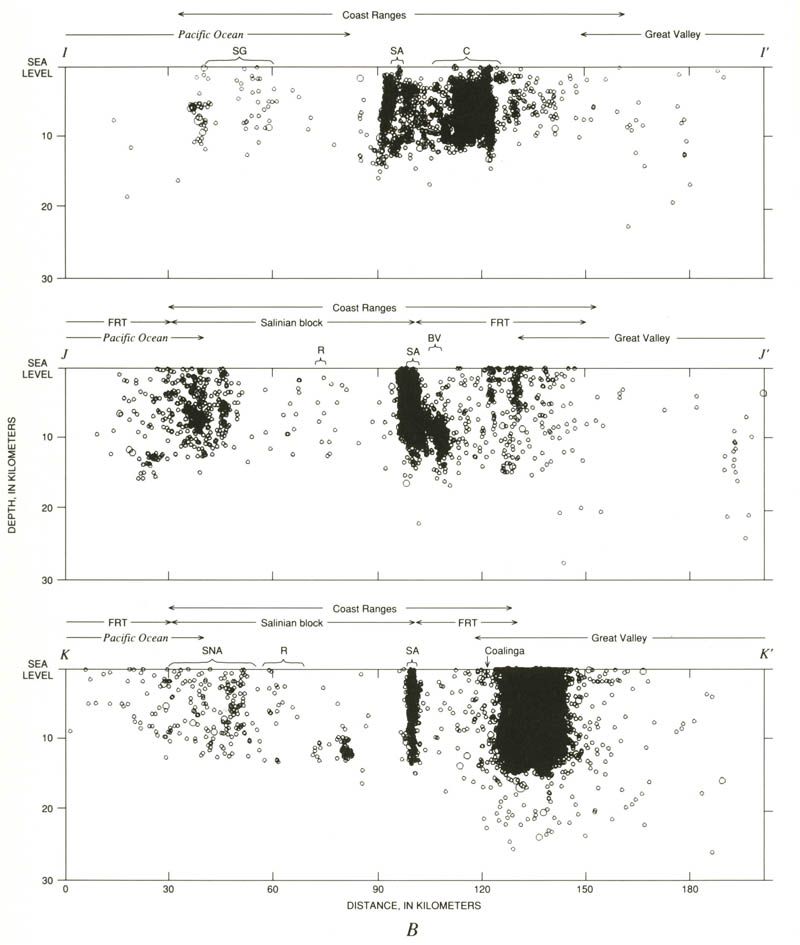
Transverse depth sections across the San Andreas fault system in the central Coast Ranges. See figure 5.6 for locations of sections and explanation of symbols, which are scaled with enlargement of cross sections. Faults: BS, Bartlett Springs; C, Calaveras; GV, Greenville; H, Hayward; M, Maacama; R, Rinconada; SA, San Andreas; SG, San Gregorio; SNA, Sur-Nacimiento. BV, Bear Valley on cross section J-J''. FRT, Franciscan terrane |
see http://plate-tectonic.narod.ru/califcrustseismphotoalbum.html
Aside from a light scattering of epicenters about the trace of the San Andreas fault through the San Francisco peninsula and the Santa Cruz Mountains to the south, the rupture zone of the 1906 earthquake is nearly aseismic. This pattern has persisted not only through the period 1980-86 shown in figure 5.6 but also at least since the mid-1930''s, when instrumental data became available for reliable earthquake locations in the area (see Bolt and Miller, 1975; Hill and others, in press). It was interrupted, however, by the M=7.1 Lorna Prieta earthquake on October 17, 1989, which ruptured the southernmost 45 km of the 1906 break (cross sec. L-L''). The cluster of epicenters along the fault just west of San Francisco coincides closely with Boore''s (1977) estimate of the epicentral location for the 1906 main shock. We note that the greatest offsets along the 1906 rupture occurred north of the epicenter along the stretch of the fault that now shows the lowest seismicity (see Thatcher and Lisowski, 1987).
The pair of subparallel epicenter lineations through the northern Coast Ranges east of the 1906 break closely follow the Rodgers Creek-Healdsburg-Maacama fault zone (west) and the Green Valley-Bartlett Springs fault zone (east). In both lineations, the epicenters tend to cluster along the eastern margins of these 2- to 3- km-wide fault zones, which are characterized by multiple strands of subparallel, curvilinear fault traces (see maps at front of book; Dehlinger and Bolt, 1984). These fault zones are essentially colinear with the Hayward and Calaveras faults to the south, although an aseismic interval coincident with the eastern arm of the San Francisco Bay (San Pablo and Suisun Bays) obscures the connection between these branches of the fault system. Most of the earthquakes defining the pair of subparallel lineations through the northern Coast Ranges are small (MĪ▄3), and, indeed, these fault zones were not recognized as seismically active branches of the San Andreas system until after the northern Coast Ranges section of the telemetered network (fig. 5.2) became operational in late 1979.
Dense clusters of epicenters just south of Clear Lake define a northeast trending pattern transverse to and midway along these northern two branches of the San Andreas fault system. The southwesternmost of these clusters represents microearthquake activity associated with the Geysers geothermal field (Eberhart-Phillips and Oppenheimer, 1984; Oppenheimer, 1986). The cluster just to the northeast underlies the Clear Lake volcanic field, which last erupted about 10 ka (Donnelly-Nolan and others, 1981). Scattered clusters farther to the northeast suggest a tenuous link between this Geysers-Clear Lake trend and the north-south-trending lineation of epicenters along the axis of the north end of the Great Valley.
In longitudinal cross section (H-H'', fig. 5.6), earthquakes occurring along the two northern branches of the San Andreas fault system are moderate in number and rather evenly distributed except for the dense, shallow cluster beneath the Geysers-Clear Lake area. The depth to the base of the continuously seismogenic crust shows considerable relief, deepening to between 12 and 13 km south of the Geysers-Clear Lake area and shallowing to only 5 km beneath and just north of the geothermal field. Farther north, the base of the seismogenic crust deepens gradually to a maximum of about 10 km. Note the isolated cluster of small but well-located events at depths of 13 to 18 km beneath Clear Lake, just north of the shallowest depths to the base of the continuously seismogenic crust. Another isolated cluster of deep earthquakes located beneath Suisun Bay have focal depths as great as 15 to 25 km. The more numerous earthquakes along branches of the fault system south of Suisun Bay paint in a dense distribution of hypocenters throughout the upper 10 to 15 km of the crust.
Although the two transverse cross sections across the northern Coast Ranges (E-E'', F-F'', fig. 5.8A) show the concentration of hypocenters around the Rodgers Creek and Green Valley branches of the San Andreas fault, they provide no hint of the location of the main branch of the San Andreas fault that ruptured in 1906. The southern of these two cross sections (F-F'') includes the dense, shallow cluster of events associated with the Geysers- Clear Lake activity, as well as the cluster of deeper events beneath the eastern margin of the Coast Ranges. Focal depths in the latter cluster, which falls at the northeast end of the Geysers-Clear Lake lineation and at the south end of the north-south-trending lineation beneath the Great Valley, range from 10 to 25 km, a depth range common to earthquakes near the north end of this Great Valley seismicity lineation (cross sec. D-D'', fig. 5.5C). Maximum focal depths increase by several kilometers from west to east in both cross sections. Farther east, they increase abruptly to depths of 25 km or so along the Great Valley lineation
CENTRAL CREEPING SECTION
Densely aligned epicenters mark the nearly straight, creeping section of the San Andreas fault that separates the south end of the 1906 break near San Juan Bautista from the north end of the 1857 break near Cholame. Densely aligned epicenters follow the Calaveras fault northward to a point just east of the south tip of the San Francisco Bay, where the Hayward fault branches to the west and the Greenville fault zone branches to the east. Few epicenters fall along the northward extension of the Calaveras fault beyond this branching point, although a diffuse cluster of epicenters coincides with the right-stepping offset between the north end of the Calaveras fault and the Concord fault. This dilatational offset was the site of pronounced earthquake swarms in June 1970 and August 1976 (Lee and others, 1971; Weaver and Hill, 1978/79).
Although these dense alignments of epicenters coincide closely with the mapped surface trace of the San Andreas fault system as first documented by Eaton and others (1970a), the coincidence is not everywhere perfect (fig. 5.6B). In the region where the Calaveras fault branches from the main trace of the San Andreas fault, for example, the densely aligned epicenters appear to be systematically displaced 3 to 4 km westward of the surface trace of the San Andreas fault and a somewhat smaller distance eastward of the surface trace of the Calaveras fault. Much of this apparent offset results from a strong contrast in rock type and P-wave velocity across the faults that is not adequately accounted for in routine hypocenter locations (Mayer-Rosa, 1973; Pavoni, 1973; Spieth, 1981). When the hypocenter locations are recalculated using a more appropriate, two-dimensional structural model, these offsets are much reduced but not completely eliminated. The remaining offsets reflect deviation of the faults from the vertical, with the San Andreas fault dipping 70ĪŃ W. (Pavoni,1973; Spieth, 1981) and the Calaveras fault dipping 80ĪŃ E. (Reasenberg and Ellsworth, 1982).
Wesson and others (1973) recognized the close correlation between active creep and persistent microseismic activity along the 200-km-Iong section of the San Andreas fault north of Parkfield and proposed that this correlation may hold for other branches of the fault in central California as well. Allen (1981) and Schultz and others (1982) pointed out that this correlation holds for the Calaveras-Hayward fault system, but creep measurements have yet to be made on the subparallel Rodgers Creek-Healdsburg-Maacama and Green Valley-Bartlett Springs faults. Creep is the dominant process for shallow slip along the central section of the San Andreas fault, and geodetic measurements spanning this section of the fault indicate that the long-term slip rate of 32 mm/yr along the fault accommodates nearly all of the local plate motion. Because it appears that little, if any, shear strain is accumulating in the blocks on either side of the fault, most seismologists believe that this section of the fault is unlikely to rupture in a great earthquake.
The creeping section of the fault system, however, has produced several moderate earthquakes during historical time (see chap. 6). The most recent of these events, which occurred along the right-branching segments northeast of the San Andreas fault, where creep rates average several millimeters per year, include (1) the M=5.9 Coyote Lake earthquake of August 6, 1979, and the M=6.2 Morgan Hill earthquake of April 24, 1984, which ruptured adjacent 20-km-Iong segments of the Calaveras fault south of its junction with the Hayward fault (Reasenberg and Ellsworth, 1982; Bakun and others, 1984); and (2) the M=5.5 and 5.8 Livermore events of January 24 and 27, 1980, which ruptured a 20-km-Iong stretch of the Greenville fault north of Livermore (Bolt and others, 1981).
The most noteworthy sequence of moderate earthquakes along the central section of the San Andreas fault involve the five virtually identical M=6 events that have ruptured the same 30-km-Iong stretch near Parkfield at nearly 22-year intervals since 1881 (Bakun and McEvilly, 1984). This stretch of the fault is defined by a 1-km right-stepping offset on the south and a 5ĪŃ W. bend on the north; it coincides with the transition between the south end of the creeping section of the fault and the north end of the 1857 break (see Bakun and Lindh, 1985, fig. 1). The most recent of these characteristic Parkfield earthquakes occurred in 1966, and an intensive monitoring experiment is underway to capture a detailed instrumental record of the next Parkfield earthquake, which is predicted to occur sometime within a 10-year window centered on 1987-88 (Bakun and Lindh, 1985).
The scattered seismicity within the Coast Ranges surrounding the San Andreas fault system is distinctly more intense in the Franciscan terrane east of the fault than in the granitic Salinian block to the west. The large, dense cluster of epicenters along the eastern margin of the Coast Ranges adjacent to the south end of the creeping section represents the aftershocks of the M=6. 7 Coalinga earthquake of May 2, 1983, and the M=5.7 Kettleman Hills earthquake of August 4, 1985, both of which involved reverse slip on northwest-striking planes subparallel to the adjacent section of the San Andreas fault (Stein and King, 1984; Eaton, 1989). Scattered clusters of epicenters within the Franciscan terrane show a crude northwest-trending alignment with the southwest edge of the Coalinga- Kettleman Hills aftershock zone and the Ortigalita fault, the north end of which passes beneath the San Luis Reservoir (LaForge and Lee, 1982). This weakly defined lineation is essentially colinear with the Greenville fault, east of the San Francisco Bay.
The Salinian block west of the central section of the San Andreas fault and east of the Sur-Nacimiento fault forms a broad, nearly aseismic swath along the west flank of the Coast Ranges. These two seismically active fault zones separate the granitic Salinian block from the Franciscan terrane on either side (see chap. 3). The Rinconada fault, within the Salinian block, appears to be nearly aseismic except, possibly, toward the south where it approaches the Sur-Nacimiento fault zone. The small cluster of epicenters just east of the midpoint of the Rinconada fault represents a persistent spot of microearthquake activity at depths of 8 to 10 km near the San Ardo oil field (Poley, 1988).
In the cross section along the central section of the San Andreas fault (L-L'', the actively creeping section of the fault shows up as a densely mottled distribution of hypocenters within the upper 12 to 15 km of the crust. The density of hypocenters within this creeping section tends to decrease with depth, and the denser clusters generally are concentrated at depths of less than 5 to 8 km. The base of the seismogenic zone undulates about an average depth of some 13 km beneath most of the creeping section, but it deepens to 15 km beneath both the northern and southern transitions to the locked sections of the fault. In contrast to the creeping section of the fault, the sparse seismicity associated with the locked segments that ruptured in 1906 (north) and 1857 (south) tends to be concentrated toward the deeper parts of the seismogenic crust. Note that the 1989 Lorna Prieta M=7.1 earthquake ruptured the 45-km-Iong section of the San Andreas fault with a pronounced U-shaped gap in shallow earthquakes immediately north of the creeping section of the fault (cross sec. L-L'').
The cross sections transverse to the central San Andreas fault system reveal the seismically active, creeping branches of the fault as narrow, near-vertical hypocenter distributions coincident with the fault plane. The broadened distribution in cross sections I-I'' and J-J'' (fig. 5.8B) reflects the oblique projection of earthquakes along the Calaveras fault zone and the clustering northeast of the fault in the Bear Valley region (Ellsworth, 1975), respectively. These transverse cross sections also emphasize the quiescence of the Salinian block relative to the Franciscan terrane on either side (note, however, the isolated cluster of deep events beneath San Ardo in the Salinian block in cross sec. K-K''), and the fairly uniform depth of 12 to 15 km to the base of the seismogenic zone that persists throughout the central Coast Ranges. As in the area farther north, however, maximum focal depths increase rather abruptly to 25 km beneath the eastern margin of the Coast Ranges and the Great Valley. This increase in focal depth is particularly pronounced beneath the dense cluster of hypocenters associated with the 1983 Coalinga earthquake and its aftershocks (cross sec. G-G'').