 | Metasomatism |
|
See http://plate-tectonic.narod.ru/metpetrographylinks.html
C http://ijolite.geology.uiuc.edu/08SprgClass/geo436/lectures.html
A. Recall Eskola''s concept of metamorphic facies:
-If bulk composition of a rock is unchanged, then different minerals => different T and P
-But, if T and P are the same, different minerals => different compositions
-Metasomatism = metamorphism that involves a change in bulk composition: most common when two rocks of contrasting composition are juxtaposed; example: carbonatite intruded into felsic silicates produced fenitization (Na-metasomatism)
B. Processes
-Change in composition => mass transfer = movement of matter into or out of the system. Two types:
-Diffusion:
-Component through a phase (Cation through a crystal lattice/Dissolved ion through a static fluid)
-Fick''s Law: Jx = flux in x-direction = -D (dc/dx) (Where c = concentration/ D = diffusion coefficient/ D is an empirical constant)
-For components diffusing through silicate minerals, D ~ 10-15 cm2/sec
-For components diffusing through a fluid phase, D > 10-4
-Infiltration:
-Mass transfer of components carried along by moving fluid
-Evidence for movement of fluids: veins, dehydration of high-grade rocks, modern geothermal systems
-May occur by hydraulic fracturing, reaction-enhanced permeability, other processes
C. Fluids
-Metamorphic rocks at the surface now are usually dry, but the one-time presence of fluids is implied by: veins, devolatilization reactions, stable isotopes
-These would have been supercritical during metamorphism
-Fluid components:
-Volatile species: C, O, H, S, F, N
-Non-volatile species: Na+, Cl-, H+, OH-, SiO2, other oxides or cations
-Common fluids - CO2-H2O, CO2-H2O-O2, H2O-CH4-H2S, chloride brines
D. Local equilibrium
-Metasomatic system may not be an equilibrium assemblage
-Small parts of the system may be in local equilibrium
-Thus, subsystems may be treated as equilibrium assemblages
II. An example of diffusion: calcareous skarns
A. Definitions
-Skarn = carbonate rock metamorphosed by silicate fluids emitted by a cooling pluton - contains Ca-Fe-Mg silicates
- various settings in which skarns may form
-Skarns develop zones, which depend on: P-T conditions; contrasting rock compositions, fluid characteristics
B. Chert nodules in marbles (Christmas Mtns, TX)
-Marbles are intruded by a gabbroic pluton
-Simple system:
-CaO-SiO2-CO2
-Initial contact between calcite and quartz
-Other minerals (Wollastonite = CaSiO3/ Tilleyite = Ca5Si2O7(CO3)2/ Rankinite = Ca3Si2O7/Spurrite = Ca5Si2O8(CO3)
-Metasomatism results from increasing T and diffusion of CaO into nodule and SiO2 from nodule into marble:
-At low T, Q + Cal stable together.
-At higher T, Q + Cal = Wo
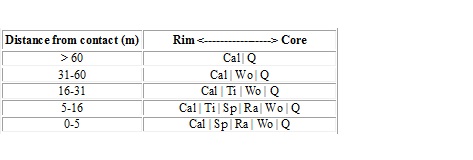
-Approaching the pluton, chert nodules develop zones:
See table
C. Chemical potential diagram
-Isobaric, isothermal plot: m of one component in a reaction vs. m of another
-As T increases, Cal + Q reacts to form Wo: CaO (aq) + SiO2(aq) = Wo:
-Reaction boundary plots as a straight line (Slope = - (coefficient of abscissa / coefficient of ordinate/ + for products, - for reactants)
-So slope = -(-1)/1 = 1
-As T increases, Cal + Wo > Ti: 5 CaO (aq) + 2 SiO2(aq) + 2 CO2(aq) = Ti: sSlope = -(-2)/(-5) = -2/5
-Closest to contact:Ti + Wo > Ra + CO2; also Ra + Cal > Sp
-Second zone out: retrograde carbonation reaction: Sp > Ti
III. An example of infiltration: Norway
A. The closure problem
-Assume 2 chemical analyses: rock 2 derived from rock 1 by metasomatism
-If a component i decreases in 2 compared with 1, which happened? : i was removed by mass transfer, OR,i was diluted by addition of other components
-Direct comparison of, say, weight % => total mass hasn''t changed. Obviously not true in metasomatism
B. Changes in volume (or mass)
-Let d = f (g2/g1) c2 - c1 :
-Where d = amount of i gained or lost
-f = volume factor where f * V1 = V2
-g = density of rocks 1 and 2
-c = concentration of i in rock 1 and 2
-Rock 1 = garnet phyllite was metasomatized to rock 2 = porphyroblastic albite schist : let f = 0.5 - 1.5, and use formula to calculate d''s for each component I; for results
-Let f = 1: Si, Na, Ca plot above the zero line on the Y-axis, so they are added during metamorphism; all others plot below, so they are removed.
-Let f < 0.6: all components show losses => 2 could have formed from 1 by removal of various amounts of each oxide.
-Let f >1.6.: all components show gains => 2 could have formed from 1 by addition of appropriate amounts of oxides.
-No way to tell by looking at rock/thin section which of these is applicable.
C. Alternative approach
- Al and Ti cross G/L = 0 at f = ~1.2 (20% volume increase): Fe and K also cross near here; vertical line through 1.2: Si, Na, Ca gain; Fe, Mg loss.
-Plot c1 = c2 for each oxide:
-Line between any point and origin is a line of constant concentration.
-Dashed line represents no gain/loss. Above = gain, below = loss (Mg, K, Fe, Ti lie near the Al line - all show losses. Si, Ca, Na show gains).
-Gives similar info as previous diagram, although no hint as to actual volume change.
