 | Global continental and ocean basin reconstructions since 200 Ma |
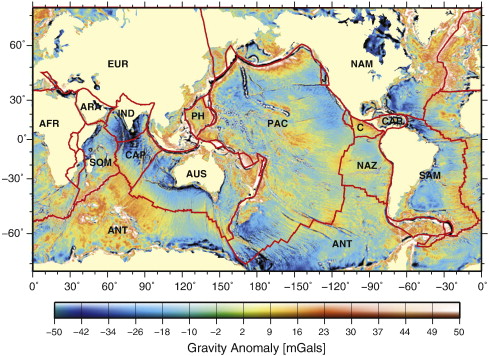
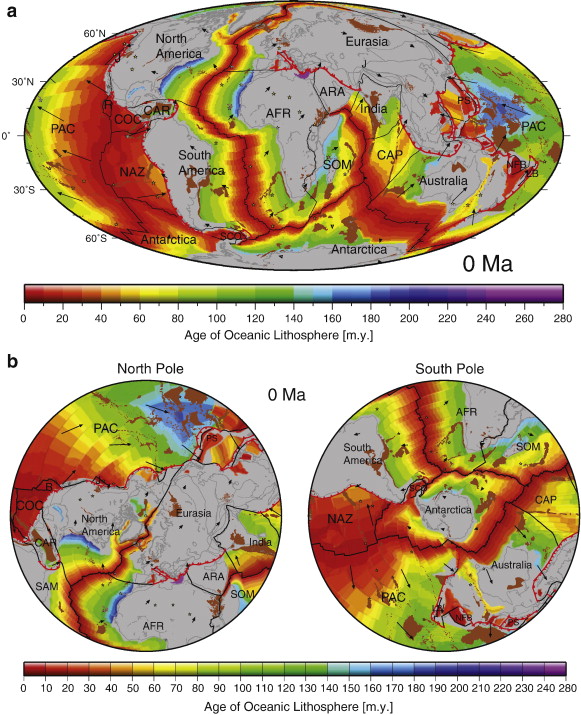
Global gravity anomalies from satellite altimetry (Sandwell and Smith 2009). Red lines denote present day plate boundaries from the plate boundary set presented in this study. AFR = Africa, ANT = Antarctica, ARA = Arabia, AUS = Australia, C = Cocos, CAP = Capricorn, CAR = Caribbean, EUR = Eurasia, IND = India, NAM = North America, NAZ = Nazca, PAC = Pacific, PH = Philippine, SAM = South America, SOM = Somalia |
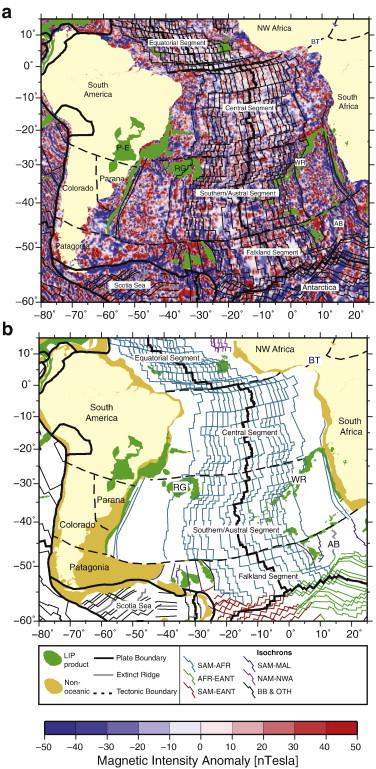
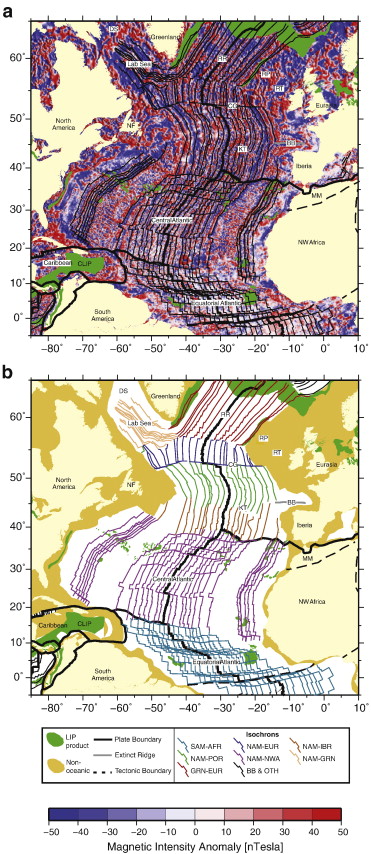
(a) Gridded magnetic anomalies for the Central and North Atlantic. Seafloor spreading isochrons used in this study plotted as thin black lines. BB = Bay of Biscay, CG = Charlie-Gibbs Fracture Zone, CLIP = Caribbean Large Igneous Province, DS = Davis Strait, JFZ = Jacksonville Fracture Zone, KT = Kings Trough, MM = Morocco Meseta, NF = Newfoundland, RR = Rekyjanes Ridge, RP = Rockall Plateau, RT = Rockall Trough. (b) Seafloor spreading isochron map colored by spreading system or plate pair. Map abbreviations are same as a. Legend abbreviations are: AFR = Africa, BB = Back-arc Basins, EUR = Eurasia, GRN = Greenland, IBR = Iberia, NAM = North America, NWA = Northwest Africa, OTH = Other spreading systems outside area of interest, POR = Porcupine, SAM = South America. |
a) Gridded magnetic anomalies for the Central and North Atlantic. Seafloor spreading isochrons used in this study plotted as thin black lines. BB = Bay of Biscay, CG = Charlie-Gibbs Fracture Zone, CLIP = Caribbean Large Igneous Province, DS = Davis Strait, JFZ = Jacksonville Fracture Zone, KT = Kings Trough, MM = Morocco Meseta, NF = Newfoundland, RR = Rekyjanes Ridge, RP = Rockall Plateau, RT = Rockall Trough. (b) Seafloor spreading isochron map colored by spreading system or plate pair. Map abbreviations are same as a. Legend abbreviations are: AFR = Africa, BB = Back-arc Basins, EUR = Eurasia, GRN = Greenland, IBR = Iberia, NAM = North America, NWA = Northwest Africa, OTH = Other spreading systems outside area of interest, POR = Porcupine, SAM = South America. |
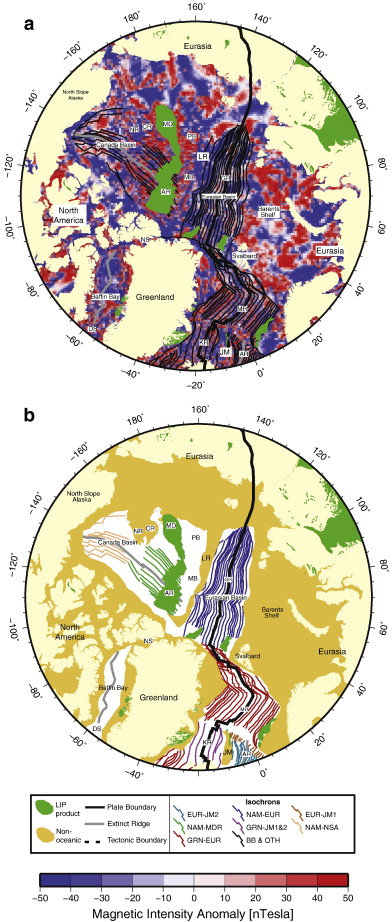
(a) Gridded magnetic anomalies for the Arctic. Seafloor spreading isochrons used in this study plotted as thin black lines. AL = Alpha Ridge, AR = Aegir Ridge, CR = Chukchi Ridge, DS = Davis Strait, GR = Gakkel Ridge, JM = Jan Mayen, KR = Kolbeinsey Ridge, LR = Lomonosov Ridge, MB = Makarov Basin, MD = Mendeleev Ridge, MR = Mohns Ridge, NR = Northwind Ridge, NS = Nares Strait, PB = Podvodnikov Basin. (b) Seafloor spreading isochron map colored by spreading system or plate pair. Map abbreviations are same as a. Legend abbreviations are: BB = Back-arc Basins, EUR = Eurasia, GRN = Greenland, JAM = Jan Mayen, MDR = Mendeleev, NAM = North America, NOR = Norway, NSA = North Slope Alaska, OTH = Other spreading systems outside area of interest. |
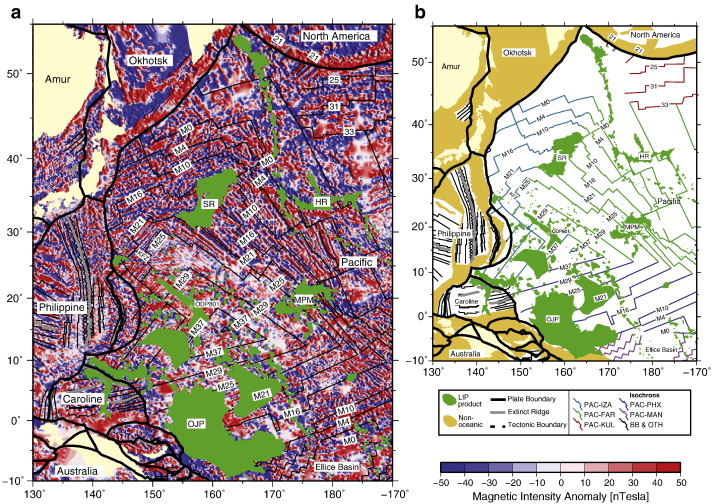
(a) Gridded magnetic anomalies for the Western Pacific, based on isotropic gridding of a combination of public domain and in-house data. Seafloor spreading isochrons used in this study plotted as thin black lines. Numbers correspond to magnetic anomaly chron. HR = Hess Rise, OJP = Ontong Java Plateau, SR = Shatsky Rise. (b) Seafloor spreading isochron map colored by spreading system or plate pair. Legend abbreviations are: BB = Back-arc Basins, FAR = Farallon, IZA = Izanagi, KUL = Kula, MAN = Manihiki, OTH = Other spreading systems outside area of interest, PAC = Pacific, PHX = Phoenix |
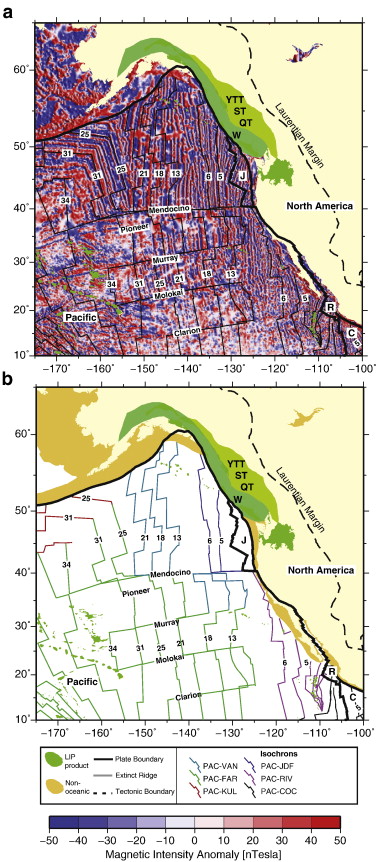
a) Gridded magnetic anomalies for the northeast Pacific. Seafloor spreading isochrons used in this study plotted as thin black lines. Numbers correspond to magnetic anomaly chron. QT = Quesnellia Terrane, ST = Stikinia Arc, W = Wrangellia, YTT = Yukon/Tanana Terrane. (b) Seafloor spreading isochron map colored by spreading system or plate pair. Map abbreviations are same as a. Legend abbreviations are: COC = Cocos, FAR = Farallon, JDF = Juan De Fuca, KUL = Kula, PAC = Pacific, R = Rivera/Guadalope, VAN = Vancouver. |
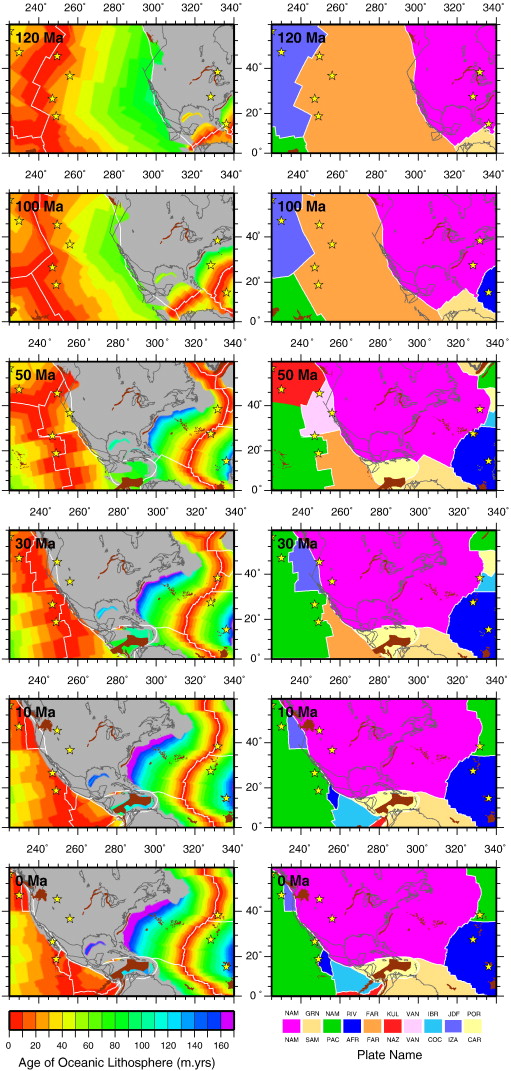
(a) Agegrid reconstructions of the northeast Pacific at 120, 100, 50, 30, 10, 0 Ma highlighting the age¢area distribution of oceanic lithosphere at the time of formation and the extent of continental crust (gray polygons). Plate boundaries from our continuously closing plate polygon dataset are denoted as thick white lines, hotspot locations as yellow stars, large igneous provinces and flood basalts as brown polygons and coastlines as thin black lines. (b) Reconstructions showing the outlines of the plates in the northeast Pacific for each reconstruction time listed above. Feature descriptions as in panel (a). Abbreviations are: AFR = African plate, CAR = Caribbean plate, COC = Cocos plate, EUR = Eurasian plate, FAR = Farallon plate, GRN = Greenland plate, IBR = Iberian plate, IZA = Izanagi plate, JDF = Juan de Fuca plate, KUL = Kula plate, NAM = North American plate, NAZ = Nazca plate, PAC = Pacific plate, POR = Porcupine plate, RIV = Rivera plate, SAM = South American plate, VAN = Vancouver plate |
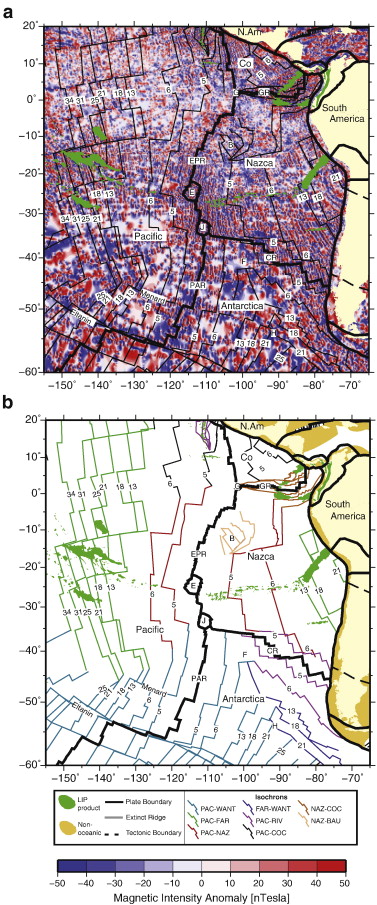
(a) Gridded magnetic anomalies for the southeast Pacific. Seafloor spreading isochrons used in this study plotted as thin black lines. Numbers correspond to magnetic anomaly chron. B = Bauer Microplate, CR = Chile Ridge, E = Easter Microplate, EPR = East Pacific Rise, F = Friday Microplate, G = Galapagos Microplate, GR = Galapagos Ridge, J = Juan Fernandez Microplate, PAR = Pacific¢Antarctic Ridge. (b) Seafloor spreading isochron map colored by spreading system or plate pair. Map abbreviations are same as a. Legend abbreviations are: BAU = Bauer, COC = Cocos, FAR = Farallon, NAZ = Nazca, PAC = Pacific, RIV = Rivera/Guadalope, WANT = West Antarctica/Antarcti |
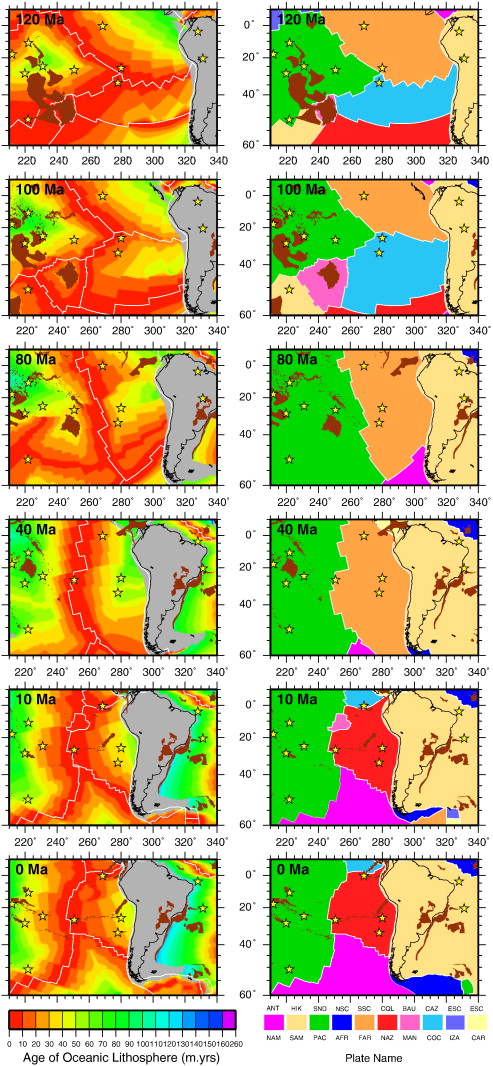
(left) Agegrid reconstructions of the southeast Pacific at 120, 100, 80, 40, 10, 0 Ma highlighting the age¢area distribution of oceanic lithosphere at the time of formation and the extent of continental crust (gray polygons). Plate boundaries from our continuously closing plate polygon dataset are denoted as thick white lines, hotspot locations as yellow stars, large igneous provinces and flood basalts as brown polygons and coastlines as thin black lines. (right) Reconstructions showing the outlines of the plates in the southeast Pacific for each reconstruction time listed above. Feature descriptions as in panel (left). Abbreviations are: AFR = African plate, ANT = Antarctic plate, BAU = Bauer plate, CAR = Caribbean plate, CAZ = Chasca plate, COC = Cocos plate, CQL = Catquil plate, ESC = East Scotia Sea plate, FAR = Farallon plate, HIK = Hikurangi plate, IZA = Izanagi plate, MAN = Manihiki plate, NAM = North American plate, NAZ = Nazca plate, NSC = North Scotia Sea plate, PAC = Pacific plate, SAM = South American plate, SND = Sandwich plate, SSC = South Scotia Sea plate |
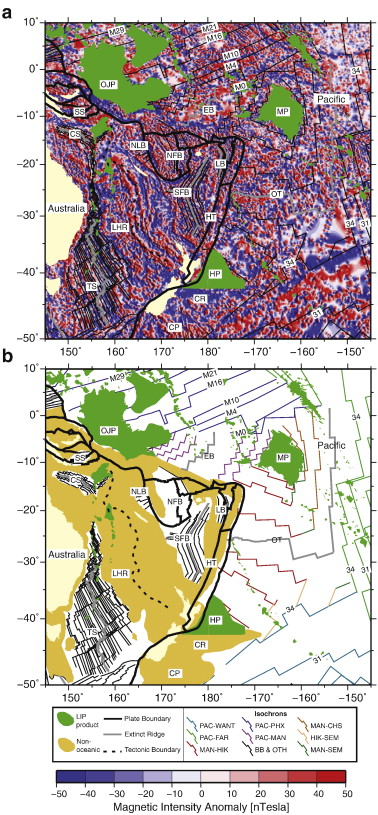
(a) Gridded magnetic anomalies for the southwest Pacific. Seafloor spreading isochrons used in this study plotted as thin black lines. Numbers correspond to magnetic anomaly chron. CP = Campbell Plateau, CR = Chatham Rise, CS = Coral Sea, EB = Ellice Basin, HP = Hikurangi Plateau, HT = Havre Trough, LB = Lau Basin, LHR = Lord Howe Rise, MP = Manihiki Plateau, NFB = North Fiji Basin, NLB = North Loyalty Basin, OJP = Ontong Java Plateau, OT = Osbourn Trough, SFB = South Fiji Basin, SS = Solomon Sea. (b) Seafloor spreading isochron map colored by spreading system or plate pair. Map abbreviations are same as a. Legend abbreviations are: BB = Back arc Basins, CHS = Chasca, FAR = Farallon, HIK = Hikurangi, MAN = Manihiki, OTH = Other, PAC = Pacific, PHX = Phoenix, SEM = Southeast Manihiki, WANT = West Antarctica/Antarctica. |
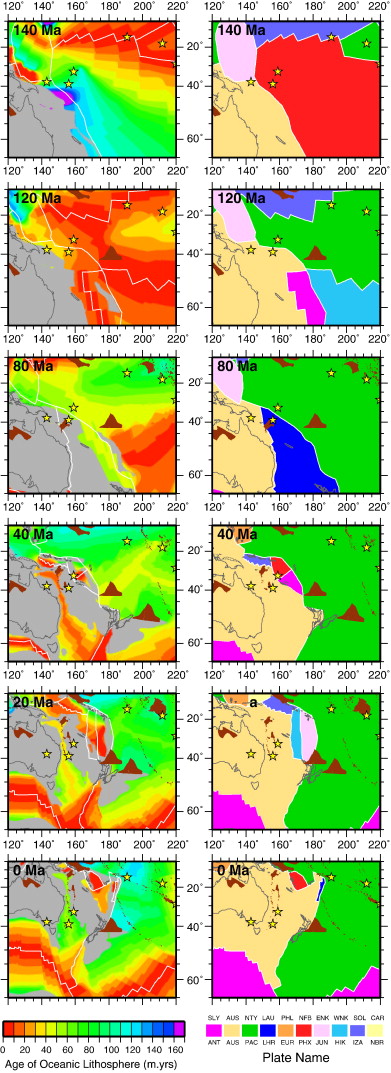
(left) Agegrid reconstructions of the southwest Pacific at 140, 120, 80, 40, 20, 0 Ma highlighting the age¢area distribution of oceanic lithosphere at the time of formation and the extent of continental crust (gray polygons). Plate boundaries from our continuously closing plate polygon dataset are denoted as thick white lines, hotspot locations as yellow stars, large igneous provinces and flood basalts as brown polygons and coastlines as thin black lines. (right) Reconstructions showing the outlines of the plates in the southwest Pacific for each reconstruction time listed above. Feature descriptions as in panel (left). Abbreviations are: ANT = Antarctic plate, AUS = Australian plate, CAR = Caroline plate, ENK = East Norfolk Basin plate, EUR = Eurasian plate, HIK = Hikurangi plate, IZA = Izanagi plate, JUN = Junction plate, LAU = Lau Basin plate, LHR = Lord Howe Rise plate, NBR = New Britain plate, NFB = North Fiji Basin plate, NTY = Neo-Tethys plate, PAC = Pacific plate, PHL = Philippine Sea plate, PHX = Phoenix plate, SLY = South Loyalty Basin plate, SOL = Solomon Sea plate, WNK = West Norfolk Basin plate. |
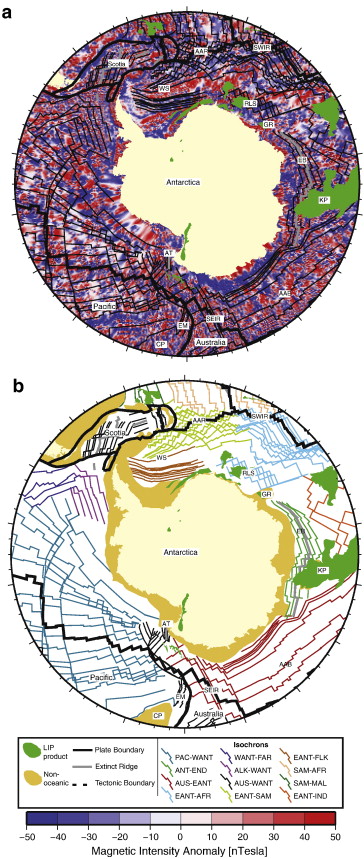
a) Gridded magnetic anomalies for the circum-Antarctic. Seafloor spreading isochrons used in this study plotted as thin black lines. AAB = Australia¢Antarctic Basin, AAR = American¢Antarctic Ridge, AT = Adare Trough, CP = Campbell Plateau, EB = Enderby Basin, EM = Emerald Basin, GR = Gunnerus Ridge, KP = Kerguelan Plateau, RLS = Riiser-Larson Sea, SEIR = Southeast Indian Ridge, SWIR = Southwest Indian Ridge, WS = Weddell Sea. (b) Seafloor spreading isochron map colored by spreading system or plate pair. Map abbreviations are same as a. Legend abbreviations are: AFR = Africa, ALK = Aluk, AUS = Australia/Lord Howe Rise, BB = Back arc Basins, EANT = East Antarctica/Antarctica, END = Enderby, FAR = Farallon, FLK = Falkland, IND = India, MAL = Malvinas, OTH = Other (Adare Trough and Emerald Basin), PAC = Pacific, SAM = South America, WANT = West Antarctica/Antarctica. |
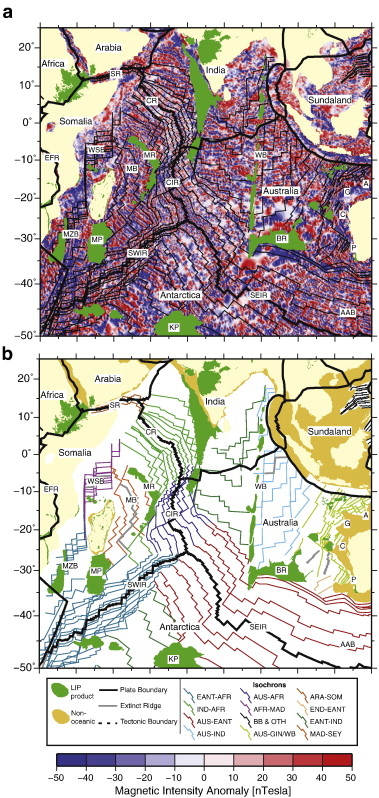
(a) Gridded magnetic anomalies for the Indian Ocean. Seafloor spreading isochrons used in this study plotted as thin black lines. A = Argo Abyssal Plain, AAB = Australia¢Antarctic Basin, BR = Broken Ridge, C = Cuvier Abyssal Plain, CIR = Central Indian Ridge, CR = Carlsberg Ridge, EFR = East Africa Rift, G = Gascoyne Abyssal Plain, KP = Kerguelan Plateau, MB = Mascarene Basin, MP = Madagascar Plateau, MR = Mascarene Ridge, MZB = Mozambique Basin, P = Perth Abyssal Plain, SEIR = Southeast Indian Ridge, SR = Sheba Ridge, SWIR = Southwest Indian Ridge, WB = Wharton Basin. (b) Seafloor spreading isochron map colored by spreading system or plate pair. Map abbreviations are same as a. Legend abbreviations are: AFR = Africa, ALK = Aluk, AUS = Australia/Lord Howe Rise, BB = Back arc Basins, EANT = East Antarctica/Antarctica, END = Enderby, FAR = Farallon, FLK = Falkland, IND = India, MAL = Malvinas, OTH = Other (Adare Trough and Emerald Basin), PAC = Pacific, SAM = South America, WANT = West Antarctica/Antarctica. |
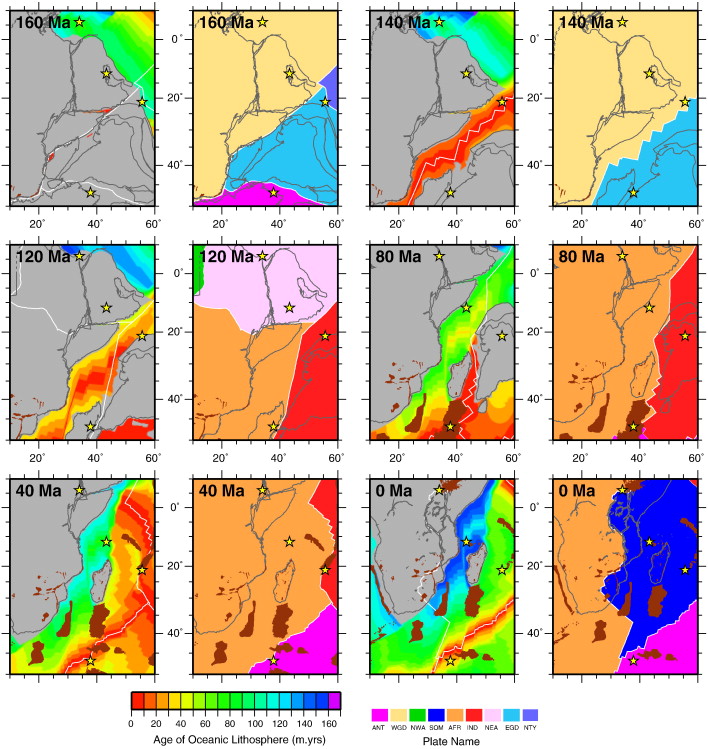
Agegrid reconstructions of the east African basins at 160, 140, 120, 80, 40, 0 Ma highlighting the age¢area distribution of oceanic lithosphere at the time of formation and the extent of continental crust (grey polygons) and reconstructions showing the outlines of the plates in the east African basins for each reconstruction time listed above. Plate boundaries from our continuously closing plate polygon dataset are denoted as thick white lines, hotspot locations as yellow stars, large igneous provinces and flood basalts as brown polygons and coastlines as thin black lines. Abbreviations are: AFR = African plate, ANT = Antarctic plate, EGD = east Gondwana plate, IND = Indian plate, NEA = northeast African plate, NTY = Neo-Tethys plate, NWA = northwest African plate, SOM = Somali plate, WGD = west Gondwana plate |
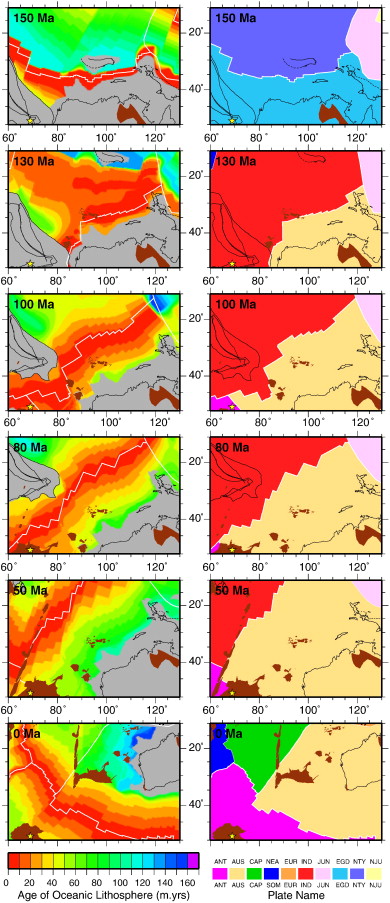
(left) Agegrid reconstructions of the west Australian margin at 150, 130, 100, 80, 50, 0 Ma highlighting the age¢area distribution of oceanic lithosphere at the time of formation and the extent of continental crust (gray polygons). Plate boundaries from our continuously closing plate polygon dataset are denoted as thick white lines, hotspot locations as yellow stars, large igneous provinces and flood basalts as brown polygons and coastlines as thin black lines. (right) Reconstructions showing the outlines of the plates in the west Australian margins for each reconstruction time listed above. Feature descriptions as in panel (left). Abbreviations are: ANT = Antarctic plate, AUS = Australian plate, CAP = Capricorn plate, EGD = east Gondwana plate, EUR = Eurasian plate, IND = Indian plate, JUN = Junction plate, NEA = northeast African plate, NJU = north Junction plate, NTY = Neo-Tethys plate, NWA = northwest African plate, SOM = Somali plate. |
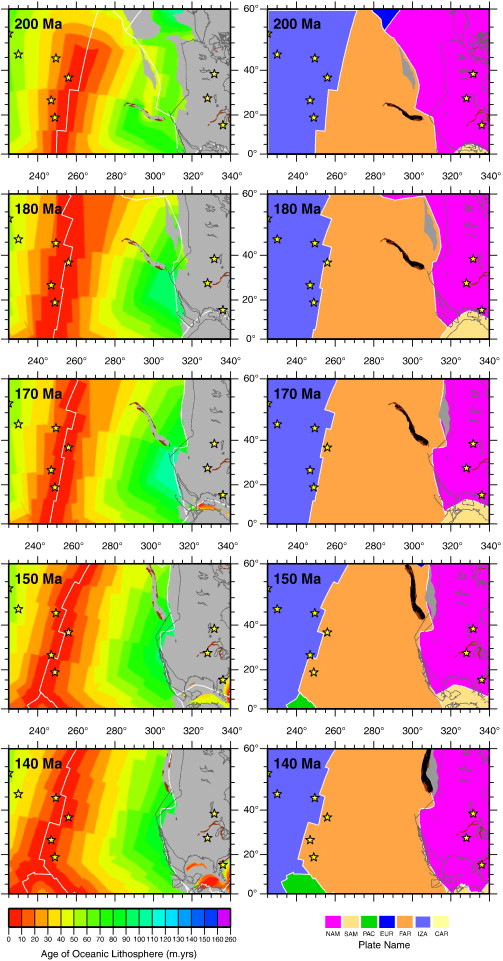
(left) Agegrid reconstructions of Mesozoic North America at 200, 180, 170, 150, 140 Ma highlighting the age¢area distribution of oceanic lithosphere at the time of formation and the extent of continental crust (gray polygons). Plate boundaries from our continuously closing plate polygon dataset are denoted as thick white lines, hotspot locations as yellow stars, large igneous provinces and flood basalts as brown polygons and coastlines as thin black lines. (right) Reconstructions showing the outlines of the plates around Mesozoic North America for each reconstruction time listed above. Feature descriptions as in panel (left). Abbreviations are: CAR = Caribbean plate, EUR = Eurasian plate, FAR = Farallon plate, IZA = Izanagi plate, NAM = North American plate, PAC = Pacific plate, SAM = South American plate. |
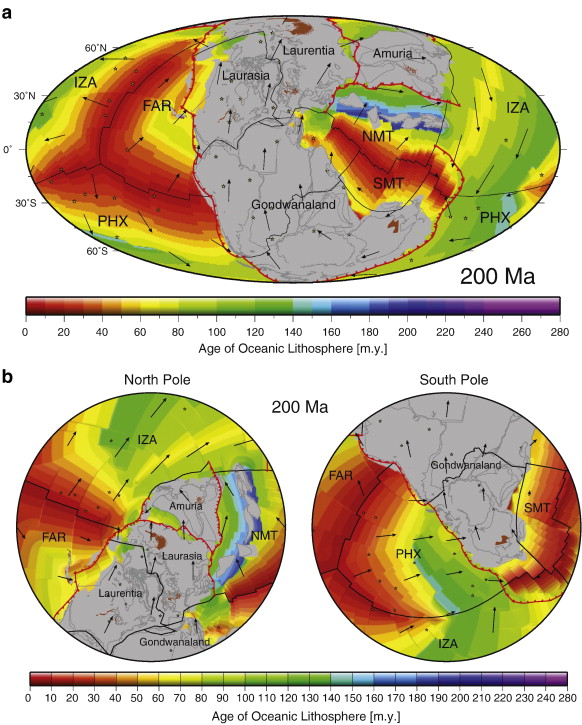
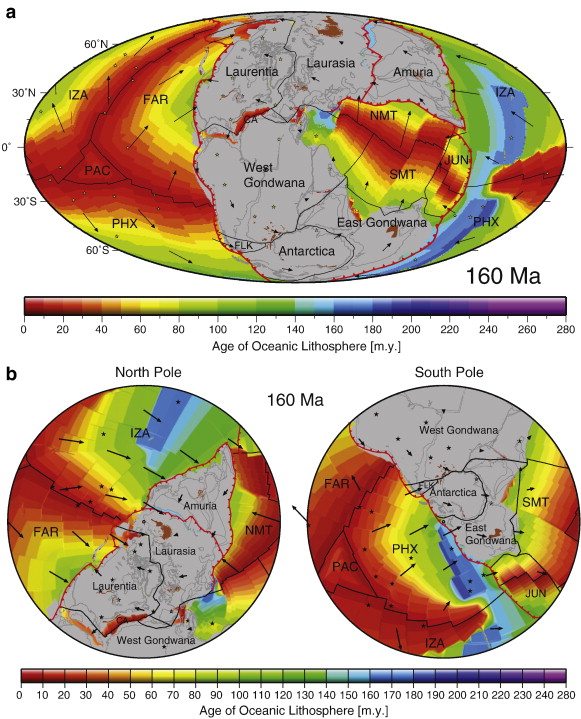
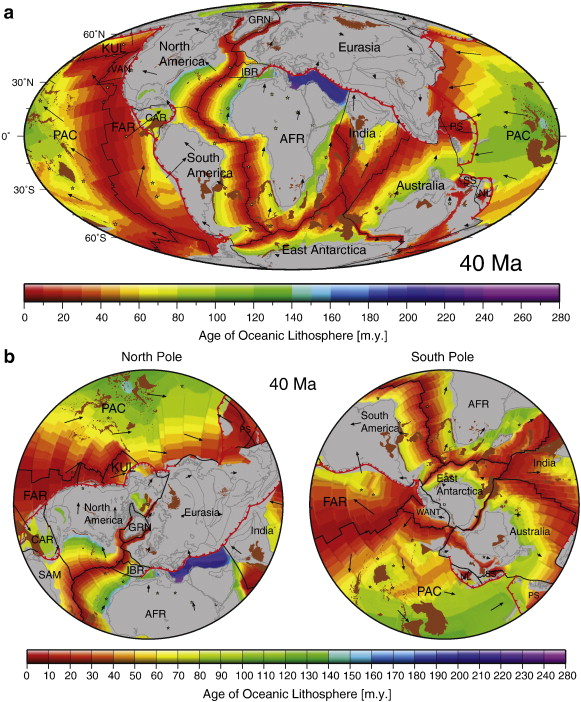
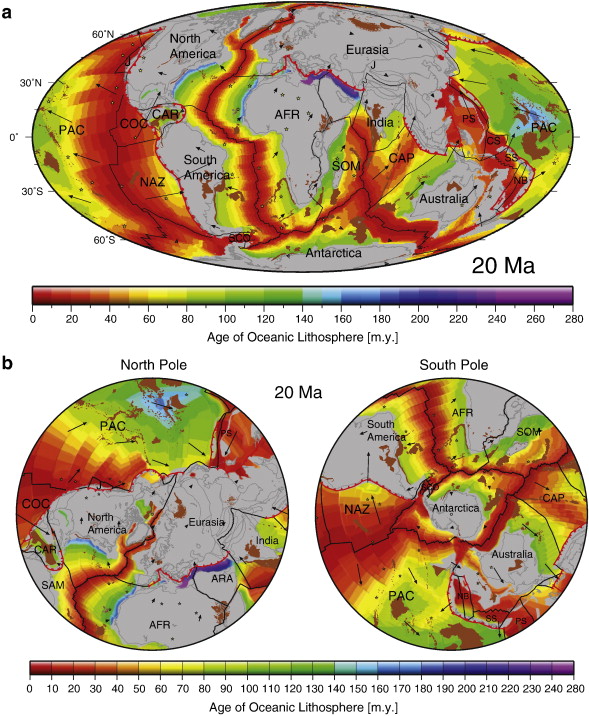
Global plate reconstructions from 200 Ma to the present day in 20 million year time intervals. Basemap shows the age¢area distribution of oceanic lithosphere at the time of formation. Red lines denote subduction zones, black lines denote mid-ocean ridges and transform faults. Brown polygons indicate products of plume-related excessive volcanism. Yellow stars are present day hotspot locations. Absolute plate velocity vectors are denoted as black arrows. Abbreviations for the plates are the same as in previous figures. Additional abbreviations include: ALA = Alaska, CA = Central Atlantic, CAP = Capricorn, CAR = Caribbean, CAT = Catequil, CCO = Cache Creek Ocean, COL = Colorado, CS = Caroline Sea, JUN = Junction, MOO = Mongol¢Okhotsk Ocean, NL = North Loyalty Basin, NMT = North Meso-Tethys, NNT = North Neo-Tethys, PAR = Parana, PAT = Patagonia, PS = Philippine Sea, PSC = Proto-South China Sea, SCO = Scotia Sea, SLB = South Loyalty Basin, SMT = South Meso-Tethys, TS = Tasman Sea. |
|
|
|
|
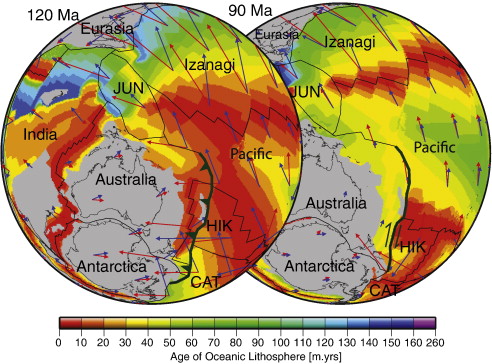
Global comparison between the Gurnis et al. (2012) plate motion model and the one presented in this study, centered on Australia and the western Panthalassic margin. Reconstructions are shown at 120 and 90 Ma with red plate velocity vectors denoting the Gurnis et al. (2012) model and blue plate velocity vectors from this study. Dark green line indicates the east Australian margin |
http://en.wikipedia.org/wiki/Plate_tectonics |
C http://www.sciencedirect.com/science/article/pii/S0012825212000311
Panthalassa; Laurasia; Tethys; Gondwana
Global plate motion models provide a spatial and temporal framework for geological data and have been effective tools for exploring processes occurring at the earth''s surface. However, published models either have insufficient temporal coverage or fail to treat tectonic plates in a self-consistent manner. They usually consider the motions of selected features attached to tectonic plates, such as continents, but generally do not explicitly account for the continuous evolution of plate boundaries through time. In order to explore the coupling between the surface and mantle, plate models are required that extend over at least a few hundred million years and treat plates as dynamic features with dynamically evolving plate boundaries. We have constructed a new type of global plate motion model consisting of a set of continuously-closing topological plate polygons with associated plate boundaries and plate velocities since the break-up of the supercontinent Pangea. Our model is underpinned by plate motions derived from reconstructing the seafloor-spreading history of the ocean basins and motions of the continents and utilizes a hybrid absolute reference frame, based on a moving hotspot model for the last 100 Ma, and a true-polar wander corrected paleomagnetic model for 200 to 100 Ma. Detailed regional geological and geophysical observations constrain plate boundary inception or cessation, and time-dependent geometry. Although our plate model is primarily designed as a reference model for a new generation of geodynamic studies by providing the surface boundary conditions for the deep earth, it is also useful for studies in disparate fields when a framework is needed for analyzing and interpreting spatio-temporal data
Global continental and ocean basin reconstructions since 200 Ma
Reconstructions
ŽļĶ“¹