 | General Tectonic Concepts and Tectonic Regimes in Sedimentary Basins |
|
|
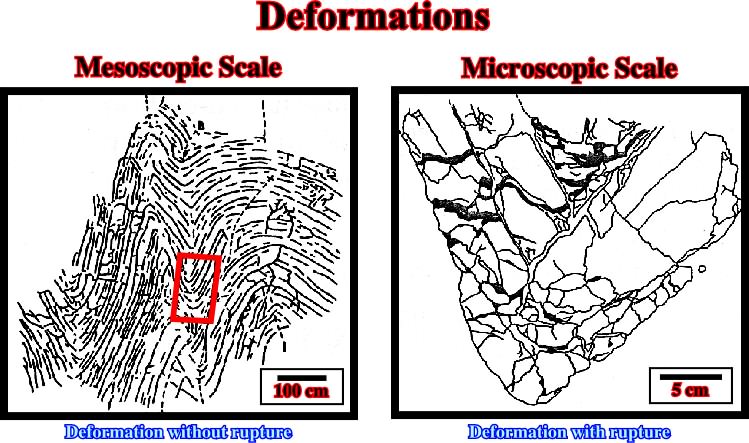
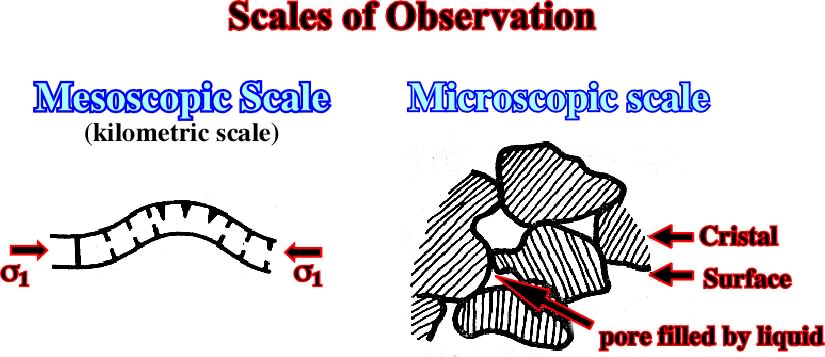
Fig. 68- The rocks are heterogeneous, discontinuous and generally anisotropic. The concepts of stress is valid only at a given scale and a given time |
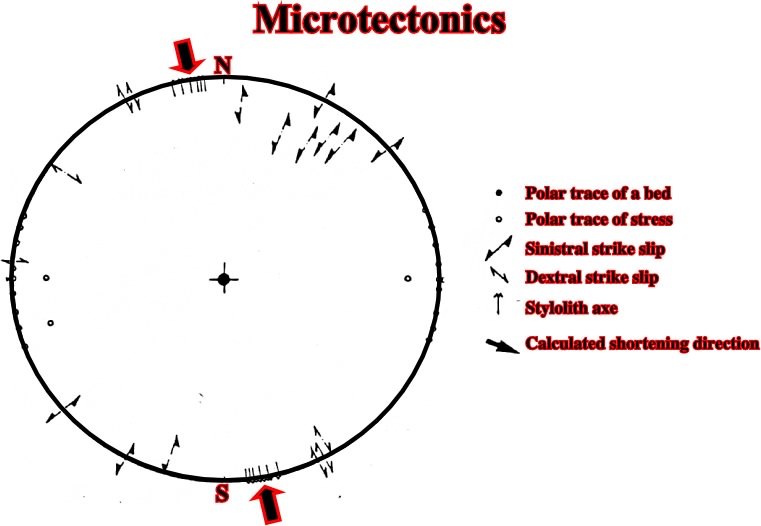
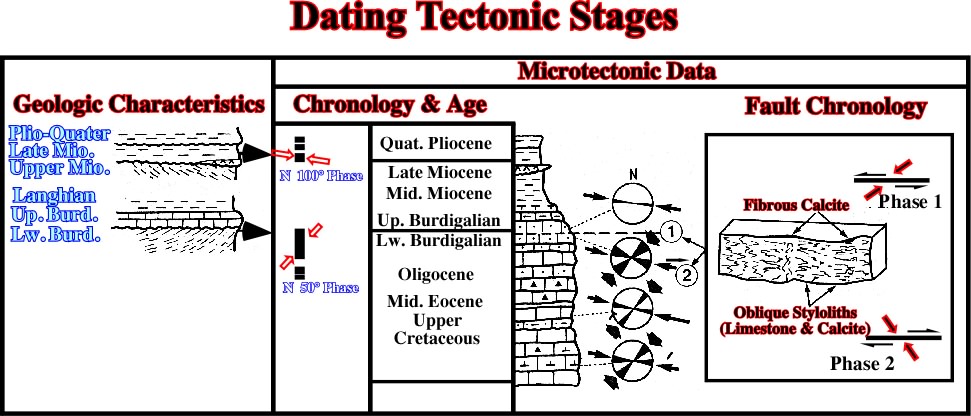
Fig. 69- Determination of the shortening direction using micro-tectonic objects. |
|
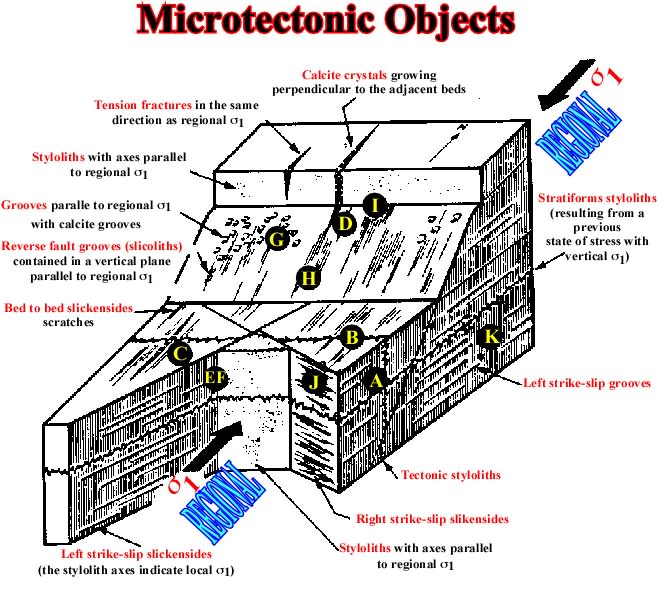
Fig. 70- Theoretically sketch illustrating the main micro-tectonic objects associated with the maximum effective stress |
Fig. 71 ¢ Determination of the age of two tectonic phases using micro-tectonic objects. |
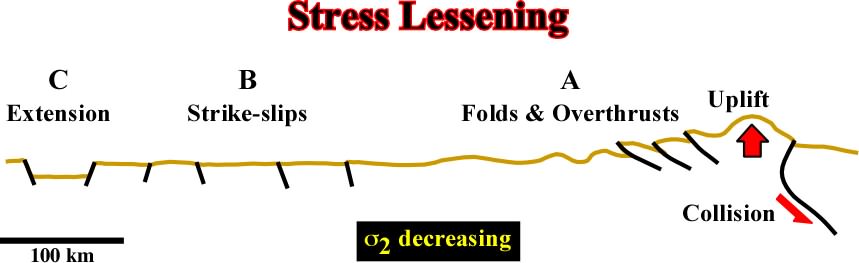
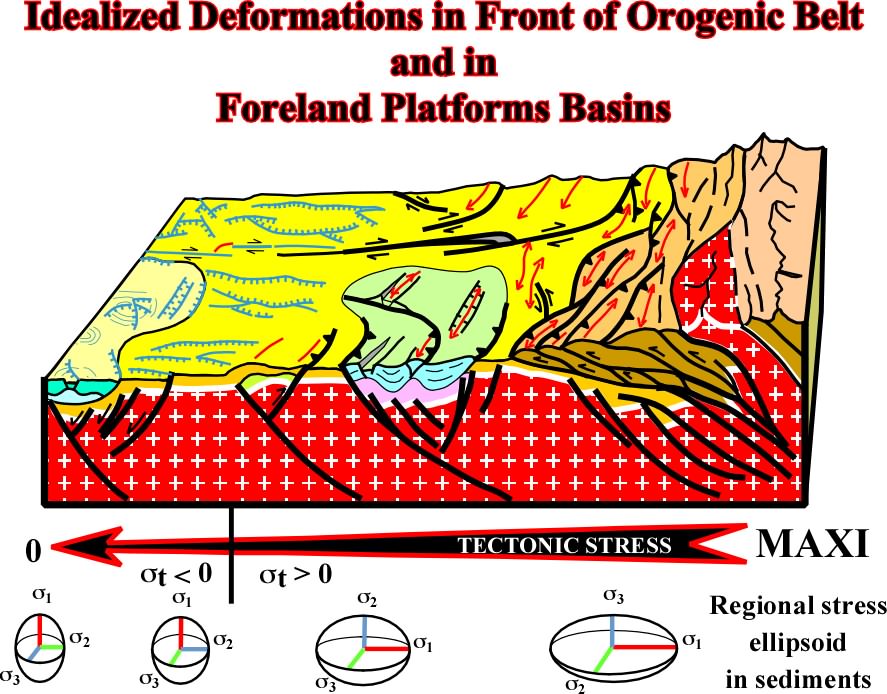
Fig. 72- Different strains are developing with the lessening of the tectonic stress. Actually, there is no lessening of effective stress but a decrease on the strength deformation of the sediments. |
|
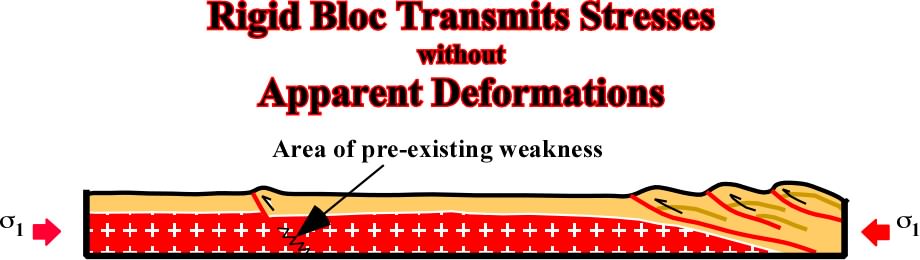
Fig. 73- Rigid blocks transmit stresses without apparent deformations. |
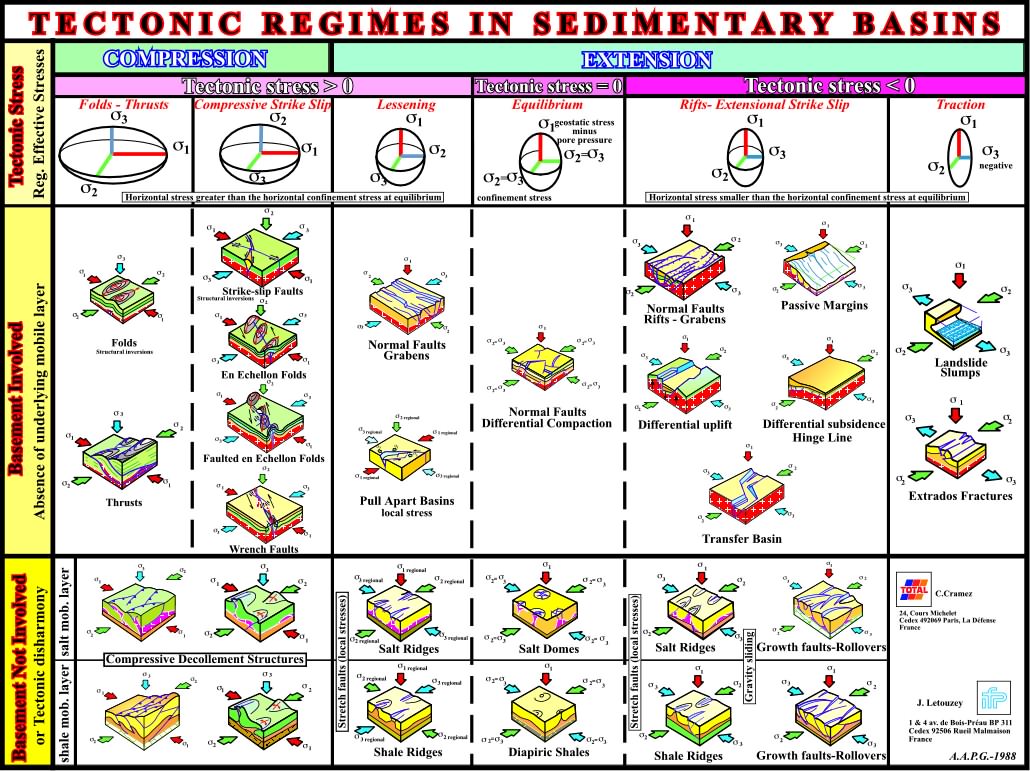
Fig.74- Classification of the tectonic regimes and associated deformations in sedimentary assuming the deformations are de consequence of a single tectonic regime. |
Fig. 75- Theoretically, assuming a lessening of the tectonic stress in the direction of a craton (in fact the lessing is not of the tectonic stress but the deformation threshold of the sediments), several tectonic regimes and associated deformation can be recognized between the orogenic foldbelt and the craton, that is to say, (i) thrust faults and cylindrical fold, (ii) strike-slip faults and conical folds, (iii) normal faults and associated grabens striking perpendicularly to the thrust faults of the fold belt. |
|
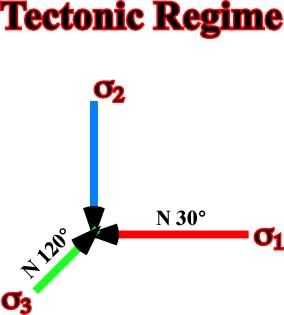
Fig.76- Firstly, this tectonic regime is characterized by a 1 horizontal striking N 30║ (shortening), secondly, the 2 is vertical, that is to say that the deformation axis is mainly horizontal. |
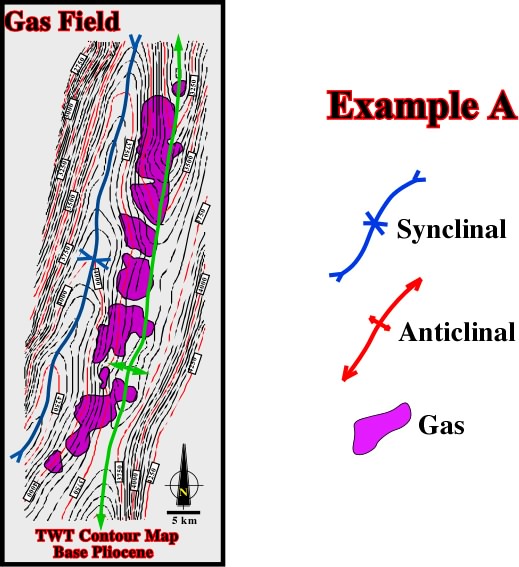
Fig. 77- This time contour map comes from a non Atlantic-type margin, that is to say, from a continental divergent margin associated with a marginal sea created by oceanization of a pre-existent back-arc basin. In other words, it can be said that the global tectonic setting of the considered area is predominantly compressional. However, one cannot forget that the occurrence of extensional tectonic regimes is necessary, since sediments cannot be shortened before being deposited. The contour map clearly indicates that folding shortened the sediments. The strike of the folds is too consistent so the interpretation is unquestionable (there are almost no chances to refute such a coherent interpretation). Therefore, as the sediments were uplifted and the structures (anticline and syncline) are cylindrical, one can say that the tectonic regime is characterized by a horizontal s1, striking more or less N 110░ , a vertical 3 and a horizontal 2, striking perpendicularly to 1, that is to say, N 200░. Such a tectonic regime corresponds to the first column of the proposed classification (ōFolds ¢ Thrustsö). |
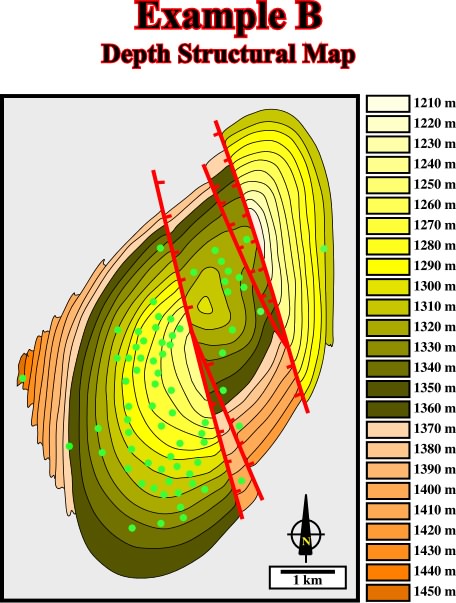
Fig. 78- This depth structural map displays the tectonic behaviour of the regional sealing interval of a large oil field located in the same area of the gas field illustrated in previous figure. So, one can say that the regional tectonic regime is characterized by a 1 horizontal striking N 130░, 2 horizontal striking N 20░ and a 3 vertical. In other words, the more likely structures occurring in the area will be cylindrical folds and thrust. The structure of the seal interval looks like an anticline striking N 20-30░, with normal faults oriented N 160-170░ near the apex of the structure. |
|
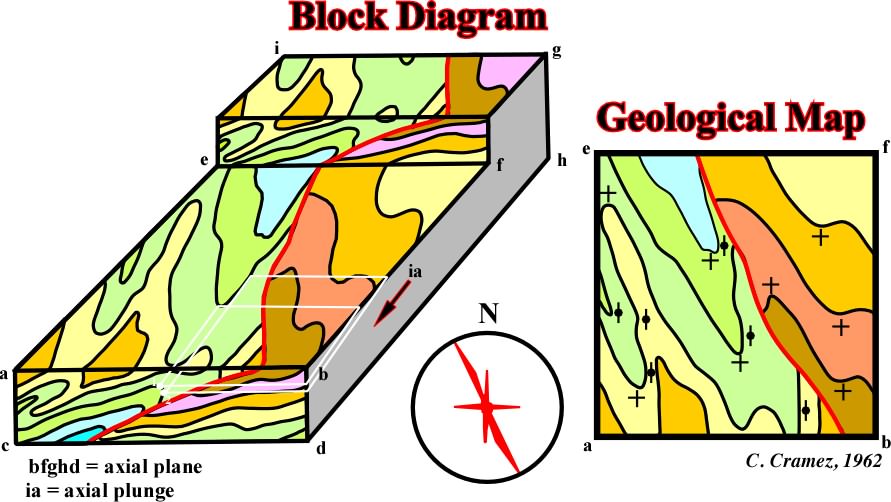
Fig. 79- This block diagram summarizes the philosophy of the 3D seismic interpretation, that is to say the interactivity between the geologic cross-sections and geologic maps (or seismic lines and seiscrops, in seismic jargon). In other words, seismic interpreters, in order to find the more likely interpretation, must interpreter not only the seismic lines, but the time slices (seiscrops) as well, which correspond to geologic maps without topography. Unfortunately, very few seismic interpreters are qualified to interpret a time slide without using the ties of the vertical seismic lines, that means that they do not use time-slices to test the profile interpretations or the profiles to test the time slice interpretation. On the contrary, they used a circular method to justify their interpretations (ōverificationismö). |
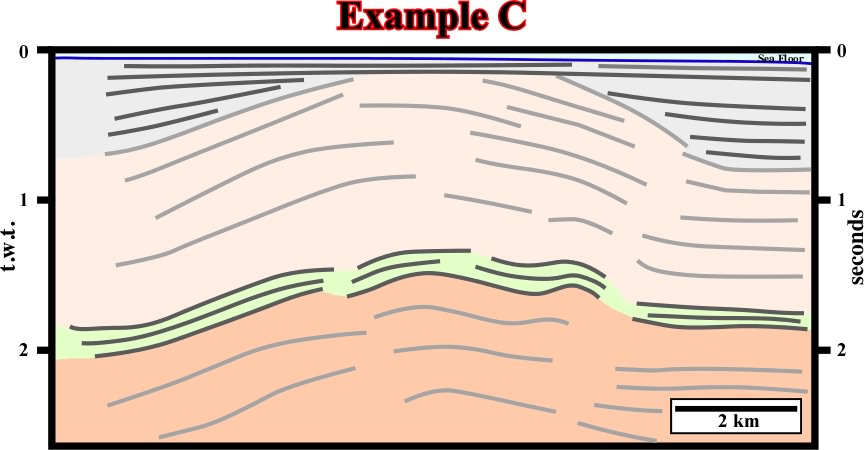
Fig. 80- This seismic profile (N-S) is representative of the area where it was shot. It is perpendicular to the structural trend. Therefore, one can say that sediments were shortened and uplifted. So, the maximum effective stress, 1, was horizontal and striking N-S. In other words, in the area, the predominant structures are (i) cylindrical folds, (ii) folds associated with tectonic inversions and (ii) thrust or reverse faults. It is relevant to point out that in a reverse fault the shortened faulted block is almost always the up-thrown block, as illustrated (reverse fault around 2 seconds, in the left part of the line). On the other hand, taking into account the different thickness of the faulted blocks (upthrown block is thicker) it is not reluctant to hypothesize the large anticline structure is associated with a tectonic inversion of a pre-existent normal fault. |
Fig. 81- On this map, the lines in black are the lineations recognized in a time slice (time geologic map without topography) in the same area of the seismic line illustrated in fig. 80. So, the interpreter knows that the tectonic regime responsible for the deformation is compressional (sediments are shortened) and characterized by a 1 horizontal striking N-S, and a 3 vertical. Consequently, he can predicted the spatial location of the more likely structures occurring in the time slice, taking into account that some of the lineations can be an inheritance from previous tectonic regimes whether compressional (1 horizontal) or extensional 1 vertical). |
|
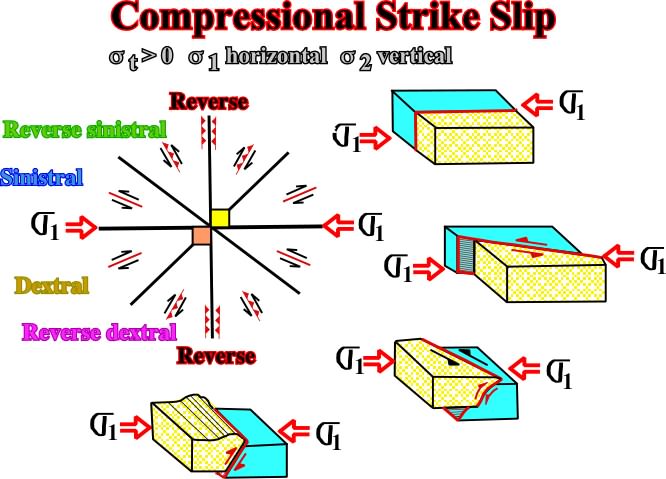
Fig. 82- Assuming lineations in all directions and a 1 striking N-S, all lineations will be reactivated. Reactivation depends on the angle between a lineation and 1. When the angle is nil, there is not reactivation. When it is 90░, the reactivation is maximum and the pre-existent fault plane is reactivated as reverse. Between these extremes, (i) reverse sinistral, (ii) sinistral, (iii) dextral and (iv) reversal dextral are possible. In such a tectonic regime only dextral and sinistral strike slip faults are neo-created. Reactivation of old pre-fractured or weak zones induce all others. |
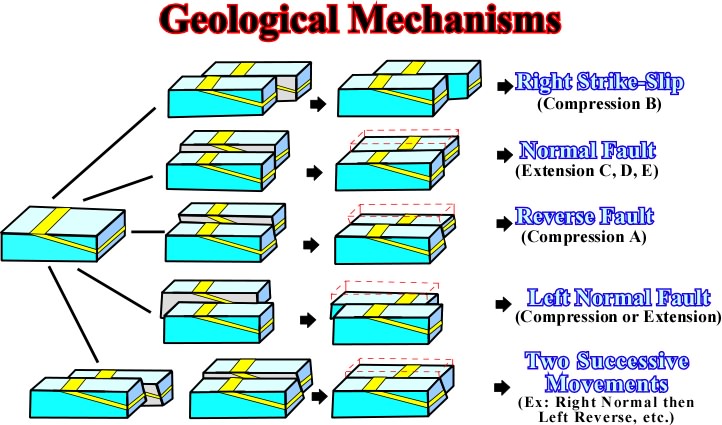
Fig. 84- Diagram illustrating that a flat geological map or in a time slice, different mechanisms can be invoked to explain observed data. The interpreter must decide what is the preferable mechanism (criterion of relative potential satisfactoriness, K. Popper, 1978). |
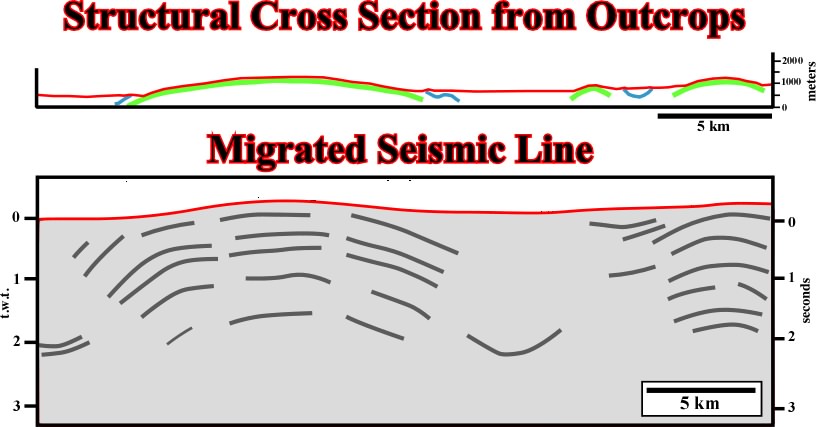
Fig. 83- On the above geological cross-section it is relatively difficult to corroborate the volume problems in depth. On the contrary, it clearly indicates the sediments were shortened and uplift. Subsequently, one can say that the tectonic regimes responsible of the shortening was charcterized by a 1 horizintal and a 3, and the more likely structures are cylindrical folds, reverse faults and thrusts. Such a knowledge, strongly help the interpreation of the seismic line (roughly parallel to the cross-section). Indeed, in depth, the sediments accommodated to the volume problems mainly by reverse faults, which are difficult to recognize on the upper levels and in surface. |

2.1- Tectonic Stages
2.2- Regional Stresses
2.3- Structural Interpretation of an Area
2.4- Structural Analysis
2.5- Dating Tectonic Stages
2.6- Stress Lessening
2.7- Deformation Tracks